
livecharts示例代码:https://lvcharts.net/App/examples/v1/wpf/Events
我应用于wpf项目中的代码:
ScrollableViewModel.cs
using LiveCharts;
using LiveCharts.Defaults;
using LiveCharts.Geared;
using System;
using System.Collections.Generic;
using System.ComponentModel;
using System.Linq;
using System.Text;
using System.Threading.Tasks;
using System.Windows.Input;

namespace WpfApp1.Resources.UserControls.Scrollable
{
    public class ScrollableViewModel : INotifyPropertyChanged
    {
        private Func<double, string> _formatter;
        private Func<double, string> _xformatter;
        private double _from;
        private double _to;
        private double _min;
        private double _max;

        public ScrollableViewModel()
        {
            DataClickCommand = new MyCommand<ChartPoint>
            {
                ExecuteDelegate = p => From = Values.FirstOrDefault().DateTime.Ticks
            };

            var now = DateTime.Now;
            var trend = -30000d;
            var l = new List<DateTimePoint>();
            var Eventl = new List<VisitsByDateTime>();
            var r = new Random();

            for (var i = 0; i < 50000; i++)
            {
                now = now.AddMilliseconds(100);

                double xx = Convert.ToDateTime(now).ToOADate();
                //每隔100毫秒
                l.Add(new DateTimePoint(now, trend));

                //每隔一分鐘造一個事件
                if (i % 600 == 0) Eventl.Add(new VisitsByDateTime { DateTime = now, Total = (decimal)1 });

                if (r.NextDouble() > 0.4)
                {
                    trend += r.NextDouble() * 10;
                }
                else
                {
                    trend -= r.NextDouble() * 10;
                }
            }

            Formatter = x => new DateTime((long)x).ToString("dd日HH时mm分ss秒fff毫秒");
            XFormatter = x => new DateTime((long)x).ToString("dd日HH时mm分");

            Values = l.AsGearedValues().WithQuality(Quality.High);
            EventValues = Eventl.AsGearedValues();

            From = DateTime.Now.AddMilliseconds(10000).Ticks;
            To = DateTime.Now.AddMilliseconds(900000).Ticks;
            Min = Values.FirstOrDefault().DateTime.Ticks;
            Max = Values.LastOrDefault().DateTime.Ticks;
        }

        public MyCommand<ChartPoint> DataClickCommand { get; set; }

        public object Mapper { get; set; }
        //波形
        public GearedValues<DateTimePoint> Values { get; set; }
        //事件
        public GearedValues<VisitsByDateTime> EventValues { get; set; }
        public double From
        {
            get { return _from; }
            set
            {
                _from = value;
                OnPropertyChanged("From");
            }
        }
        public double To
        {
            get { return _to; }
            set
            {
                _to = value;
                OnPropertyChanged("To");
            }
        }
        public double Min
        {
            get { return _min; }
            set
            {
                _min = value;
                OnPropertyChanged("Min");
            }
        }
        public double Max
        {
            get { return _max; }
            set
            {
                _max = value;
                OnPropertyChanged("Max");
            }
        }

        public Func<double, string> Formatter
        {
            get { return _formatter; }
            set
            {
                _formatter = value;
                OnPropertyChanged("Formatter");
            }
        }

        public Func<double, string> XFormatter
        {
            get { return _xformatter; }
            set
            {
                _xformatter = value;
                OnPropertyChanged("XFormatter");
            }
        }

        public event PropertyChangedEventHandler PropertyChanged;

        protected virtual void OnPropertyChanged(string propertyName = null)
        {
            if (PropertyChanged != null)
                PropertyChanged.Invoke(this, new PropertyChangedEventArgs(propertyName));
        }
    }

    public class MyCommand<T> : ICommand where T : class
    {
        public Predicate<T> CanExecuteDelegate { get; set; }
        public Action<T> ExecuteDelegate { get; set; }

        public bool CanExecute(object parameter)
        {
            return CanExecuteDelegate == null || CanExecuteDelegate((T)parameter);
        }

        public void Execute(object parameter)
        {
            if (ExecuteDelegate != null) ExecuteDelegate((T)parameter);
        }

        public event EventHandler CanExecuteChanged
        {
            add { CommandManager.RequerySuggested += value; }
            remove { CommandManager.RequerySuggested -= value; }
        }
    }
}
ScrollableViewE.xaml
<UserControl x:Class="WpfApp1.Resources.UserControls.ScrollableE.ScrollableViewE"
             xmlns="http://schemas.microsoft.com/winfx/2006/xaml/presentation"
             xmlns:x="http://schemas.microsoft.com/winfx/2006/xaml"
             xmlns:mc="http://schemas.openxmlformats.org/markup-compatibility/2006"
             xmlns:d="http://schemas.microsoft.com/expression/blend/2008"
             xmlns:local="clr-namespace:WpfApp1.Resources.UserControls.ScrollableE"
             xmlns:lvc="clr-namespace:LiveCharts.Wpf;assembly=LiveCharts.Wpf"
             xmlns:geared="clr-namespace:LiveCharts.Geared;assembly=LiveCharts.Geared"
             xmlns:scrollable="clr-namespace:WpfApp1.Resources.UserControls.Scrollable"
             mc:Ignorable="d"
             d:DesignHeight="450" d:DesignWidth="800">
    <UserControl.DataContext>
        <scrollable:ScrollableViewModel></scrollable:ScrollableViewModel>
    </UserControl.DataContext>
    <Grid>
        <lvc:CartesianChart Name="ScrollChart"
                            DisableAnimations="True"
                            ClipToBounds="True"
                            Zoom="X"
                            DataClick="ChartOnDataClick"
                            Margin="20 10">
            <lvc:CartesianChart.Resources>
                <Style TargetType="lvc:Separator">
                    <Setter Property="IsEnabled" Value="False"></Setter>
                </Style>
            </lvc:CartesianChart.Resources>
            <lvc:CartesianChart.Series>
                <geared:GColumnSeries Values="{Binding EventValues}" StrokeThickness="3"/>
                <geared:GLineSeries Values="{Binding Values}"
                                    LineSmoothness="0"
                                    StrokeThickness="2"
                                    Stroke="#00e701"
                                    PointGeometry="{x:Null}"
                                    AreaLimit="0"/>
            </lvc:CartesianChart.Series>
            <lvc:CartesianChart.AxisX>
                <lvc:Axis IsMerged="True" LabelFormatter="{Binding XFormatter, Mode=OneTime}"
                          MinValue="{Binding Min, Mode=TwoWay}"
                          MaxValue="{Binding Max, Mode=TwoWay}"
                          Foreground="#fff"
                          FontSize="12"
                          FontWeight="UltraBold"/>
            </lvc:CartesianChart.AxisX>
            <lvc:CartesianChart.AxisY>
                <lvc:Axis ShowLabels="False" />
            </lvc:CartesianChart.AxisY>
        </lvc:CartesianChart>
    </Grid>
</UserControl>
ScrollableViewE.cs
using LiveCharts;
using LiveCharts.Wpf;
using System;
using System.Collections.Generic;
using System.Linq;
using System.Text;
using System.Threading.Tasks;
using System.Windows;
using System.Windows.Controls;
using System.Windows.Data;
using System.Windows.Documents;
using System.Windows.Input;
using System.Windows.Media;
using System.Windows.Media.Imaging;
using System.Windows.Navigation;
using System.Windows.Shapes;

namespace WpfApp1.Resources.UserControls.ScrollableE
{
    /// <summary>
    /// ScrollableViewE.xaml 的交互逻辑
    /// </summary>
    public partial class ScrollableViewE : UserControl
    {
        public ScrollableViewE()
        {
            InitializeComponent();
        }
        private void ChartOnDataClick(object sender, ChartPoint p)
        {
            Console.WriteLine("[EVENT] You clicked (" + p.X + ", " + p.Y + ")");
        }
    }
}
运行截图: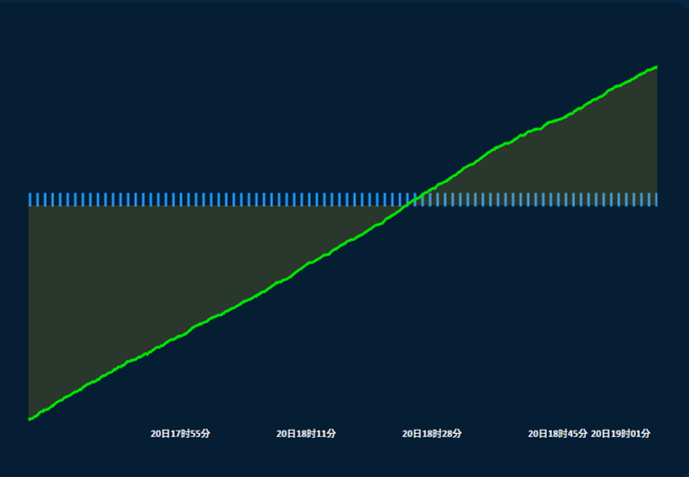
问题:当我点击折线图的时候可以进入到ChartOnDataClick方法,但是为什么点击柱状图的时候没反应呢?怎么才能让点击柱状图的时候进入到ChartOnDataClick方法?


