
小弟最近写一个程序时需要实现一个在tab栏中切换不同的echarts图标的显示问题:在tab栏切换后再切换回来其父盒子div有大小,但是echarts大小为0x0;
同时自己再测了一下,当我跳转到没有echarts的页面再跳转回有echarts的后echarts能正常显示,但是从一个有echarts页面A跳到另一个有echarts的页面B第一次可以成功,但再从B跳会A时,A中其它元素可以正常显示,但是echarts就是显示不出来,已经卡了好几天了,网上的方法也试了一下不知道是不是自己试的方法对不对,拜托各位大神帮忙看看谢谢!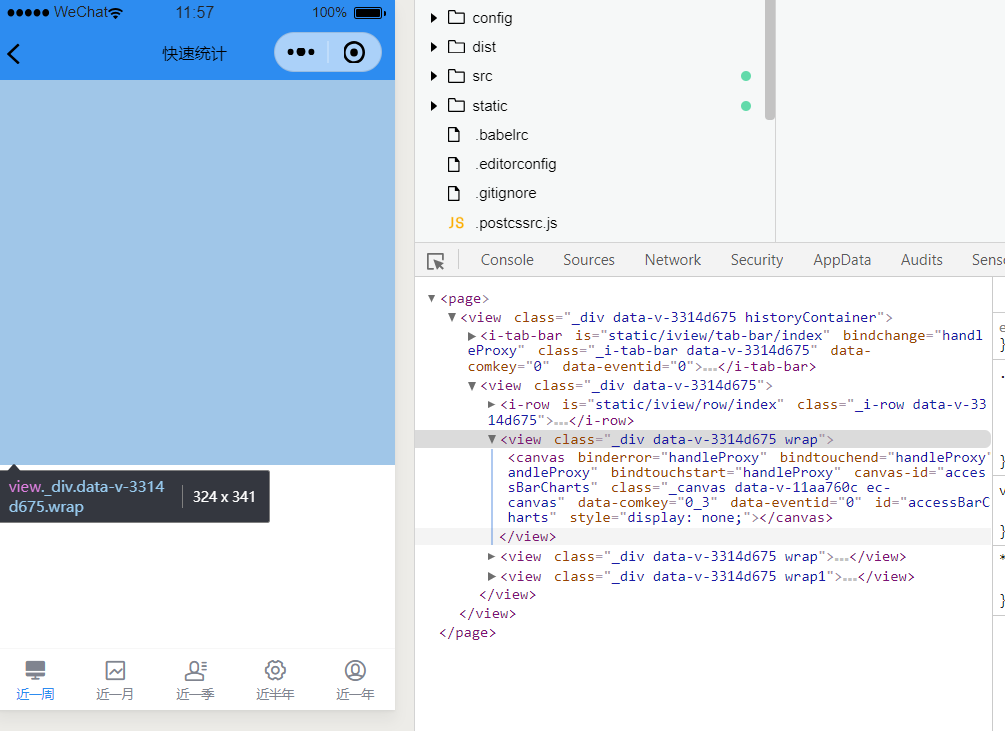
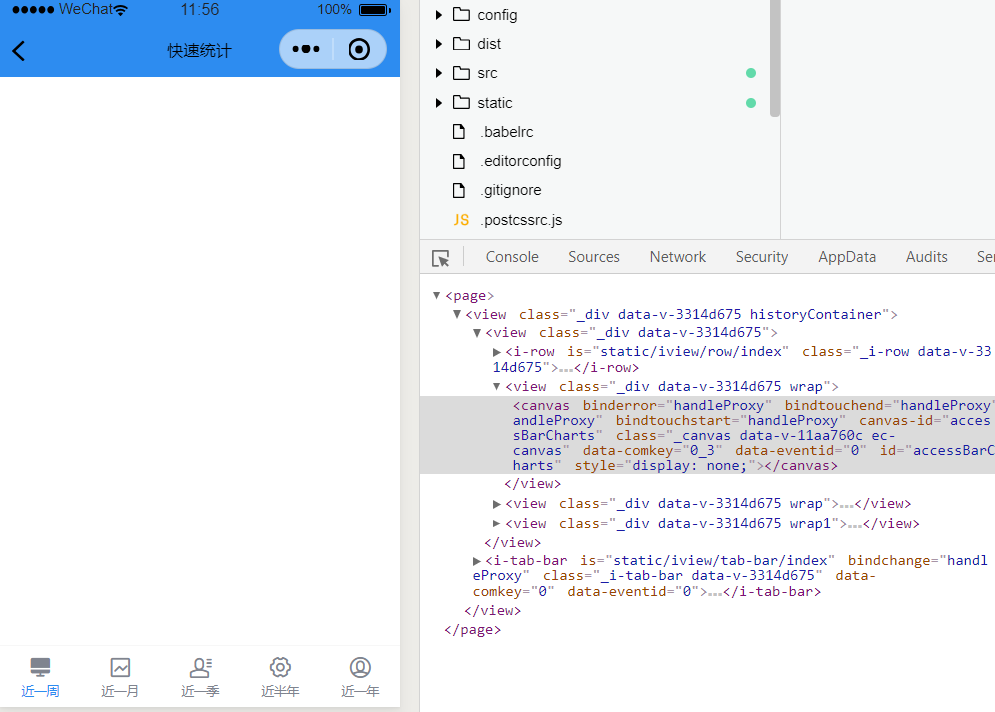
实现过程是用把echarts放在不同的div中,通过tab按下时捕获的值给current从而让相应的div中的图表显示出来:
 <div  v-if="current === 'month'">
    <div class="wrap">
      <mpvue-echarts lazyLoad :echarts="echarts" :onInit="handleAccessBarInit" canvasId="accessBarCharts" ref="accessBarCharts" />
    </div>
    <div class="wrap">
      <mpvue-echarts lazyLoad :echarts="echarts" :onInit="handleBarInit" ref="barCharts" canvasId="bar" />
    </div>
    <div class="wrap1">
      <mpvue-echarts lazyLoad :echarts="echarts" :onInit="handleLineInit" ref="lineCharts" canvasId="line" />
    </div>
    </div>

    <div v-if="current === 'quarter'">
    <div class="wrap">
      <mpvue-echarts lazyLoad :echarts="echarts" :onInit="handleAccessBarInit" canvasId="accessBarCharts" ref="accessBarCharts" />
    </div>
    <div class="wrap">
      <mpvue-echarts lazyLoad :echarts="echarts" :onInit="handleBarInit" ref="barCharts" canvasId="bar" />
    </div>
    <div class="wrap1">
      <mpvue-echarts lazyLoad :echarts="echarts" :onInit="handleLineInit" ref="lineCharts" canvasId="line" />
    </div>
    </div>
当按下了相应的tab后,会调用相应的获取数据函数:
     // tab栏切换
      handleChangeTabbar(e) {
        this.current = e.target.key;
        console.log("按下了tab栏");
        console.log(this.current);
        if(this.current=="seven"){this.getChartData(7);}
        else if(this.current == "month"){ this.getChartData(30);}
        else if(this.current == "quarter"){this.getChartData(90)}
        else if(this.current == "halfyear"){this.getChartData(180)}
        else if(this.current == "year"){this.getChartData(365)}
      }
在获取数据函数中最后调用了图表的初始化函数init:
  async getChartData(typeChange) {
        const body = {
          stationId: this.stationId,
          "access-token": this.accessToken,
          type:typeChange
        }
        console.log(body)
        const resp = await post('/station/data_statistics', body);
        console.log(resp)
        const { code, data } = resp;
        let barXAxisData = [];
        let barSeriesData = [];
        let barAccessXAxisData = [];
        let barAccessSeriesData = [];
        let lineXAxisData = [];
        let lineSeriesData = [];
        let lineAccessSeriesData = [];
        let lineTotalSeriesData = [];
        if (code === 200) {
          console.log(data)
          let axleTotalNum = 0;
          let axleAccessNum = 0;
          let totalNum = 0;
          let accessNum = 0;
          // 遍历各车轴总车数
          for(var k = 0, length = data.axleTotalNum.length; k < length; k++){
             // 分别将对象中数据提到数组中,然后轴数给x轴,将总数给y轴
            barXAxisData.push(data.axleTotalNum[k].axle)
            barSeriesData.push(data.axleTotalNum[k].num)
            // 把所有车轴的过车数加起来,在左上角显示过车总数
            axleTotalNum = axleTotalNum + data.axleTotalNum[k].num
          }
          // 遍历各车轴超车数
          for(var k = 0, length = data.axleAccessNum.length; k < length; k++){
            barAccessXAxisData.push(data.axleAccessNum[k].axle)
            barAccessSeriesData.push(data.axleAccessNum[k].num)
            // 把所有车轴的超车数加起来,在右上角显示超车总数
            axleAccessNum = axleAccessNum + data.axleAccessNum[k].num
          }
          // 遍历7日中各日过车总数
          for(var k = 0, length = data.totalNum.length; k < length; k++){
            //把日期存进x轴的数组
            lineXAxisData.push(data.totalNum[k].day)
            // 把具体每日数目存进y轴的数组
            lineTotalSeriesData.push(data.totalNum[k].num)
             // 统计的是7日的过车总数,其实与上面的各轴车过车总数结果一样
            totalNum = totalNum + data.totalNum[k].num
          }
          // 遍历7日中各日超车总数
          for(var k = 0, length = data.excessNum.length; k < length; k++){
            console.log(k)
            // 只统计y轴数据即可,因为其与7日过车数在折线图中一起显示,上面已经有x轴
            lineAccessSeriesData.push(data.excessNum[k].num)
            accessNum = accessNum + data.excessNum[k].num
          }
          console.log(lineXAxisData,barSeriesData,barAccessXAxisData,barAccessSeriesData,lineXAxisData,lineSeriesData)
          // 把折线图中的两个y轴数组存到同一个数组中?
          lineSeriesData.push(lineAccessSeriesData, lineTotalSeriesData);
          console.log(lineXAxisData)
           // 其实这4个变量是两两相等的
          this.accessNum = accessNum;
          this.totalNum = totalNum;
          this.axleTotalNum = axleTotalNum;
          this.axleAccessNum = axleAccessNum;
        }
        console.log(lineXAxisData, lineSeriesData)
        this.initBarChart(barXAxisData, barSeriesData,typeChange)
        this.initAccessBarChart(barAccessXAxisData, barAccessSeriesData,typeChange)
        this.initLineChart(lineXAxisData, lineSeriesData,typeChange)
      },
图表初始函数如下,其中写明了一些图表基础设置并进行setoption:
 initBarChart(xAxisData, seriesData,typeChange) {
       if(typeChange==7){
          this.barOption = {
          title: {
            text: "近七日过车车型",
            textStyle: {
              fontSize: 14
            },
            left: 'center'
          },
          legend: {
            right: '14',
            data: [{name:'车轴数'}]
          },
          grid: {
            left: 10,
            right: 20,
            bottom: 15,
            top: 30,
            containLabel: true
          },
          color: ['#2d8cf0', '#19be6b', '#ff9900'],
          xAxis: {
            type: 'category',
            data: xAxisData,
          },
          yAxis: {
            type: 'value',
            axisLine: {
              lineStyle: {
                color: '#999'
              }
            },
            axisLabel: {
              color: '#666'
            }
          },
          series:[{
            type: 'bar',
            name: '车轴数',
            label: {
              normal: {
                show: true,
                position: 'inside'
              }
            },
            data: seriesData
          }]
        }
       } else if(typeChange==30){
          this.barOption = {
          title: {
            text: "近一月过车车型",
            textStyle: {
              fontSize: 14
            },
            left: 'center'
          },
          legend: {
            right: '14',
            data: [{name:'车轴数'}]
          },
          grid: {
            left: 10,
            right: 20,
            bottom: 15,
            top: 30,
            containLabel: true
          },
          color: ['#2d8cf0', '#19be6b', '#ff9900'],
          xAxis: {
            type: 'category',
            data: xAxisData,
          },
          yAxis: {
            type: 'value',
            axisLine: {
              lineStyle: {
                color: '#999'
              }
            },
            axisLabel: {
              color: '#666'
            }
          },
          series:[{
            type: 'bar',
            name: '车轴数',
            label: {
              normal: {
                show: true,
                position: 'inside'
              }
            },
            data: seriesData
          }]
        }
       }else if(typeChange==90){
        this.barOption = {
          title: {
            text: "近一季过车车型",
            textStyle: {
              fontSize: 14
            },
            left: 'center'
          },
          legend: {
            right: '14',
            data: [{name:'车轴数'}]
          },
          grid: {
            left: 10,
            right: 20,
            bottom: 15,
            top: 30,
            containLabel: true
          },
          color: ['#2d8cf0', '#19be6b', '#ff9900'],
          xAxis: {
            type: 'category',
            data: xAxisData,
          },
          yAxis: {
            type: 'value',
            axisLine: {
              lineStyle: {
                color: '#999'
              }
            },
            axisLabel: {
              color: '#666'
            }
          },
          series:[{
            type: 'bar',
            name: '车轴数',
            label: {
              normal: {
                show: true,
                position: 'inside'
              }
            },
            data: seriesData
          }]
        }
       }else if(typeChange==180){
        this.barOption = {
          title: {
            text: "近半年过车车型",
            textStyle: {
              fontSize: 14
            },
            left: 'center'
          },
          legend: {
            right: '14',
            data: [{name:'车轴数'}]
          },
          grid: {
            left: 10,
            right: 20,
            bottom: 15,
            top: 30,
            containLabel: true
          },
          color: ['#2d8cf0', '#19be6b', '#ff9900'],
          xAxis: {
            type: 'category',
            data: xAxisData,
          },
          yAxis: {
            type: 'value',
            axisLine: {
              lineStyle: {
                color: '#999'
              }
            },
            axisLabel: {
              color: '#666'
            }
          },
          series:[{
            type: 'bar',
            name: '车轴数',
            label: {
              normal: {
                show: true,
                position: 'inside'
              }
            },
            data: seriesData
          }]
        }
       }
        this.$refs.barCharts.init()
      },
最后再于图表的html部分中绑定了下面函数进行渲染:
 handleBarInit (canvas, width, height) {
         console.log("打印表2宽高");
         console.log(this.wdith);
         console.log(this.height);
        barChart = echarts.init(canvas, null, {
          width: width,
          height: height,
        })
        canvas.setChart(barChart)
        barChart.setOption(this.barOption,true)
        return barChart
      },
最后附上该页面完整代码,请大家帮忙看看谢谢~
<template>
<div class="historyContainer">
<div v-if="current === 'seven'">
<i-row>
<i-col span="8" offset="2" i-class="col-class">
<div class="headerCard">
<h4>近七日过车数:</h4>
<p>{{totalNum}}</p>
</div>
</i-col>
<i-col span="8" offset="4" i-class="col-class">
<div class="headerCard">
<h4>近七日超车数:</h4>
<p>{{accessNum}}</p>
</div>
</i-col>
</i-row>
<div class="wrap">
<mpvue-echarts lazyLoad :echarts="echarts" :onInit="handleAccessBarInit" canvasId="accessBarCharts" ref="accessBarCharts" />
</div>
<div class="wrap">
<mpvue-echarts lazyLoad :echarts="echarts" :onInit="handleBarInit" ref="barCharts" canvasId="bar" />
</div>
<div class="wrap1">
<mpvue-echarts lazyLoad :echarts="echarts" :onInit="handleLineInit" ref="lineCharts" canvasId="line" />
</div>
</div>
<div v-if="current === 'month'">
<i-row>
<i-col span="8" offset="2" i-class="col-class">
<div class="headerCard">
<h4>近一月过车数:</h4>
<p>{{totalNum}}</p>
</div>
</i-col>
<i-col span="8" offset="4" i-class="col-class">
<div class="headerCard">
<h4>近一月超车数:</h4>
<p>{{accessNum}}</p>
</div>
</i-col>
</i-row>
<div class="wrap">
<mpvue-echarts lazyLoad :echarts="echarts" :onInit="handleAccessBarInit" canvasId="accessBarCharts" ref="accessBarCharts" />
</div>
<div class="wrap">
<mpvue-echarts lazyLoad :echarts="echarts" :onInit="handleBarInit" ref="barCharts" canvasId="bar" />
</div>
<div class="wrap1">
<mpvue-echarts lazyLoad :echarts="echarts" :onInit="handleLineInit" ref="lineCharts" canvasId="line" />
</div>
</div>
<div v-if="current === 'quarter'">
<i-row>
<i-col span="8" offset="2" i-class="col-class">
<div class="headerCard">
<h4>近一季过车数:</h4>
<p>{{totalNum}}</p>
</div>
</i-col>
<i-col span="8" offset="4" i-class="col-class">
<div class="headerCard">
<h4>近一季超车数:</h4>
<p>{{accessNum}}</p>
</div>
</i-col>
</i-row>
<div class="wrap">
<mpvue-echarts lazyLoad :echarts="echarts" :onInit="handleAccessBarInit" canvasId="accessBarCharts" ref="accessBarCharts" />
</div>
<div class="wrap">
<mpvue-echarts lazyLoad :echarts="echarts" :onInit="handleBarInit" ref="barCharts" canvasId="bar" />
</div>
<div class="wrap1">
<mpvue-echarts lazyLoad :echarts="echarts" :onInit="handleLineInit" ref="lineCharts" canvasId="line" />
</div>
</div>
<div v-if="current === 'halfyear'">
<i-row>
<i-col span="8" offset="2" i-class="col-class">
<div class="headerCard">
<h4>近半年过车数:</h4>
<p>{{totalNum}}</p>
</div>
</i-col>
<i-col span="8" offset="4" i-class="col-class">
<div class="headerCard">
<h4>近半年超车数:</h4>
<p>{{accessNum}}</p>
</div>
</i-col>
</i-row>
<div class="wrap">
<mpvue-echarts lazyLoad :echarts="echarts" :onInit="handleAccessBarInit" canvasId="accessBarCharts" ref="accessBarCharts" />
</div>
<div class="wrap">
<mpvue-echarts lazyLoad :echarts="echarts" :onInit="handleBarInit" ref="barCharts" canvasId="bar" />
</div>
<div class="wrap1">
<mpvue-echarts lazyLoad :echarts="echarts" :onInit="handleLineInit" ref="lineCharts" canvasId="line" />
</div>
</div>
<div v-if="current === 'year'">
这是一年
</div>
<i-tab-bar fixed="true" :current="current" @change="handleChangeTabbar">
<i-tab-bar-item key="seven" icon="computer" current-icon="computer_fill" title="近一周"></i-tab-bar-item>
<i-tab-bar-item key="month" icon="dynamic" current-icon="dynamic_fill" title="近一月"></i-tab-bar-item>
<i-tab-bar-item key="quarter" icon="addressbook" current-icon="addressbook_fill" title="近一季"></i-tab-bar-item>
<i-tab-bar-item key="halfyear" icon="setup" current-icon="setup_fill" title="近半年"></i-tab-bar-item>
<i-tab-bar-item key="year" icon="mine" current-icon="mine_fill" title="近一年"></i-tab-bar-item>
</i-tab-bar>
</div>
</template>
<script>
import echarts from 'echarts'
import mpvueEcharts from 'mpvue-echarts';
import { post } from '@/api/request.js';
let barChart, accessBarChart, lineChart;
export default {
onLoad(options) {
const {
stationId,
accessToken
} = options;
this.stationId = stationId;
this.accessToken = accessToken;
},
data() {
return {
current:'seven',
stationId: '',
accessToken: '',
echarts,
totalNum: 0,
accessNum: 0,
axleTotalNum: 0,
axleAccessNum: 0,
// type:7,//暂时默认七天
barOption: null,
accessBarOption: null,
lineOption: null
}
},
components: {
mpvueEcharts
},
mounted() {
this.getChartData(7);
},
methods: {
initBarChart(xAxisData, seriesData,typeChange) {
if(typeChange==7){
this.barOption = {
title: {
text: "近七日过车车型",
textStyle: {
fontSize: 14
},
left: 'center'
},
legend: {
right: '14',
data: [{name:'车轴数'}]
},
grid: {
left: 10,
right: 20,
bottom: 15,
top: 30,
containLabel: true
},
color: ['#2d8cf0', '#19be6b', '#ff9900'],
xAxis: {
type: 'category',
data: xAxisData,
},
yAxis: {
type: 'value',
axisLine: {
lineStyle: {
color: '#999'
}
},
axisLabel: {
color: '#666'
}
},
series:[{
type: 'bar',
name: '车轴数',
label: {
normal: {
show: true,
position: 'inside'
}
},
data: seriesData
}]
}
} else if(typeChange==30){
this.barOption = {
title: {
text: "近一月过车车型",
textStyle: {
fontSize: 14
},
left: 'center'
},
legend: {
right: '14',
data: [{name:'车轴数'}]
},
grid: {
left: 10,
right: 20,
bottom: 15,
top: 30,
containLabel: true
},
color: ['#2d8cf0', '#19be6b', '#ff9900'],
xAxis: {
type: 'category',
data: xAxisData,
},
yAxis: {
type: 'value',
axisLine: {
lineStyle: {
color: '#999'
}
},
axisLabel: {
color: '#666'
}
},
series:[{
type: 'bar',
name: '车轴数',
label: {
normal: {
show: true,
position: 'inside'
}
},
data: seriesData
}]
}
}else if(typeChange==90){
this.barOption = {
title: {
text: "近一季过车车型",
textStyle: {
fontSize: 14
},
left: 'center'
},
legend: {
right: '14',
data: [{name:'车轴数'}]
},
grid: {
left: 10,
right: 20,
bottom: 15,
top: 30,
containLabel: true
},
color: ['#2d8cf0', '#19be6b', '#ff9900'],
xAxis: {
type: 'category',
data: xAxisData,
},
yAxis: {
type: 'value',
axisLine: {
lineStyle: {
color: '#999'
}
},
axisLabel: {
color: '#666'
}
},
series:[{
type: 'bar',
name: '车轴数',
label: {
normal: {
show: true,
position: 'inside'
}
},
data: seriesData
}]
}
}else if(typeChange==180){
this.barOption = {
title: {
text: "近半年过车车型",
textStyle: {
fontSize: 14
},
left: 'center'
},
legend: {
right: '14',
data: [{name:'车轴数'}]
},
grid: {
left: 10,
right: 20,
bottom: 15,
top: 30,
containLabel: true
},
color: ['#2d8cf0', '#19be6b', '#ff9900'],
xAxis: {
type: 'category',
data: xAxisData,
},
yAxis: {
type: 'value',
axisLine: {
lineStyle: {
color: '#999'
}
},
axisLabel: {
color: '#666'
}
},
series:[{
type: 'bar',
name: '车轴数',
label: {
normal: {
show: true,
position: 'inside'
}
},
data: seriesData
}]
}
}
this.$refs.barCharts.init()
},
handleBarInit (canvas, width, height) {
console.log("打印表2宽高");
console.log(this.wdith);
console.log(this.height);
barChart = echarts.init(canvas, null, {
width: width,
height: height,
})
canvas.setChart(barChart)
barChart.setOption(this.barOption,true)
return barChart
},
initAccessBarChart(xAxisData, seriesData,typeChange) {
if(typeChange==7){
this.accessBarOption = {
title: {
text: "近七日超车车型",
textStyle: {
fontSize: 14
},
left: 'center'
},
legend: {
right: '14',
data: [{name:'车轴数'}]
},
grid: {
left: 10,
right: 20,
bottom: 15,
top: 30,
containLabel: true
},
color: ['#5cadff', '#19be6b', '#ff9900'],
xAxis: {
type: 'category',
data: xAxisData,
},
yAxis: {
type: 'value',
axisLine: {
lineStyle: {
color: '#999'
}
},
axisLabel: {
color: '#666'
}
},
series:[{
type: 'bar',
name: '车轴数',
label: {
normal: {
show: true,
position: 'inside'
}
},
data: seriesData
}]
}
} else if(typeChange==30){
this.accessBarOption = {
title: {
text: "近一月超车车型",
textStyle: {
fontSize: 14
},
left: 'center'
},
legend: {
right: '14',
data: [{name:'车轴数'}]
},
grid: {
left: 10,
right: 20,
bottom: 15,
top: 30,
containLabel: true
},
color: ['#5cadff', '#19be6b', '#ff9900'],
xAxis: {
type: 'category',
data: xAxisData,
},
yAxis: {
type: 'value',
axisLine: {
lineStyle: {
color: '#999'
}
},
axisLabel: {
color: '#666'
}
},
series:[{
type: 'bar',
name: '车轴数',
label: {
normal: {
show: true,
position: 'inside'
}
},
data: seriesData
}]
}
}else if(typeChange==90){
this.accessBarOption = {
title: {
text: "近一季超车车型",
textStyle: {
fontSize: 14
},
left: 'center'
},
legend: {
right: '14',
data: [{name:'车轴数'}]
},
grid: {
left: 10,
right: 20,
bottom: 15,
top: 30,
containLabel: true
},
color: ['#5cadff', '#19be6b', '#ff9900'],
xAxis: {
type: 'category',
data: xAxisData,
},
yAxis: {
type: 'value',
axisLine: {
lineStyle: {
color: '#999'
}
},
axisLabel: {
color: '#666'
}
},
series:[{
type: 'bar',
name: '车轴数',
label: {
normal: {
show: true,
position: 'inside'
}
},
data: seriesData
}]
}
}else if(typeChange==180){
this.accessBarOption = {
title: {
text: "近半年超车车型",
textStyle: {
fontSize: 14
},
left: 'center'
},
legend: {
right: '14',
data: [{name:'车轴数'}]
},
grid: {
left: 10,
right: 20,
bottom: 15,
top: 30,
containLabel: true
},
color: ['#5cadff', '#19be6b', '#ff9900'],
xAxis: {
type: 'category',
data: xAxisData,
},
yAxis: {
type: 'value',
axisLine: {
lineStyle: {
color: '#999'
}
},
axisLabel: {
color: '#666'
}
},
series:[{
type: 'bar',
name: '车轴数',
label: {
normal: {
show: true,
position: 'inside'
}
},
data: seriesData
}]
}
}
this.$refs.accessBarCharts.init()
},
handleAccessBarInit (canvas, width, height) {
console.log("打印表1宽高");
console.log(this.wdith);
console.log(this.height);
accessBarChart = echarts.init(canvas, null, {
width: width,
height: height
})
canvas.setChart(accessBarChart)
accessBarChart.setOption(this.accessBarOption,true)
return accessBarChart
},
initLineChart(xAxisData, seriesData,typeChange) {
if(typeChange==7){
this.lineOption = {
title: {
text: "近7日车流量和超车数",
textStyle: {
fontSize: 14
},
left: 'center'
},
tooltip: {
show: true,
trigger: 'axis',
formatter: '日期:{b}\n{a0}: {c1}\n{a1}: {c0}'
},
legend: {
right: '14',
orient: 'vertical',
data: [{name:'总数'},{name:"超载数"}]
},
grid: {
left: 10,
right: 20,
bottom: 15,
top: 50,
containLabel: true
},
color: ['#5cadff', '#ff9900'],
xAxis: {
data: xAxisData,
triggerEvent : true
},
yAxis: {
type: 'value',
axisLine: {
lineStyle: {
color: '#999'
}
},
axisLabel: {
color: '#666'
}
},
series:[{
type: 'line',
name: '超载数',
data: seriesData[0]
},{
type: 'line',
name: '总数',
data: seriesData[1]
}]
}
} else if(typeChange==30){
this.lineOption = {
title: {
text: "近一月车流量和超车数",
textStyle: {
fontSize: 14
},
left: 'center'
},
tooltip: {
show: true,
trigger: 'axis',
formatter: '日期:{b}\n{a0}: {c1}\n{a1}: {c0}'
},
legend: {
right: '14',
orient: 'vertical',
data: [{name:'总数'},{name:"超载数"}]
},
grid: {
left: 10,
right: 20,
bottom: 15,
top: 50,
containLabel: true
},
color: ['#5cadff', '#ff9900'],
xAxis: {
data: xAxisData,
triggerEvent : true
},
yAxis: {
type: 'value',
axisLine: {
lineStyle: {
color: '#999'
}
},
axisLabel: {
color: '#666'
}
},
series:[{
type: 'line',
name: '超载数',
data: seriesData[0]
},{
type: 'line',
name: '总数',
data: seriesData[1]
}]
}
} else if(typeChange==90){
this.lineOption = {
title: {
text: "近一季车流量和超车数",
textStyle: {
fontSize: 14
},
left: 'center'
},
tooltip: {
show: true,
trigger: 'axis',
formatter: '日期:{b}\n{a0}: {c1}\n{a1}: {c0}'
},
legend: {
right: '14',
orient: 'vertical',
data: [{name:'总数'},{name:"超载数"}]
},
grid: {
left: 10,
right: 20,
bottom: 15,
top: 50,
containLabel: true
},
color: ['#5cadff', '#ff9900'],
xAxis: {
data: xAxisData,
triggerEvent : true
},
yAxis: {
type: 'value',
axisLine: {
lineStyle: {
color: '#999'
}
},
axisLabel: {
color: '#666'
}
},
series:[{
type: 'line',
name: '超载数',
data: seriesData[0]
},{
type: 'line',
name: '总数',
data: seriesData[1]
}]
}
} else if(typeChange==180){
this.lineOption = {
title: {
text: "近半年车流量和超车数",
textStyle: {
fontSize: 14
},
left: 'center'
},
tooltip: {
show: true,
trigger: 'axis',
formatter: '日期:{b}\n{a0}: {c1}\n{a1}: {c0}'
},
legend: {
right: '14',
orient: 'vertical',
data: [{name:'总数'},{name:"超载数"}]
},
grid: {
left: 10,
right: 20,
bottom: 15,
top: 50,
containLabel: true
},
color: ['#5cadff', '#ff9900'],
xAxis: {
data: xAxisData,
triggerEvent : true
},
yAxis: {
type: 'value',
axisLine: {
lineStyle: {
color: '#999'
}
},
axisLabel: {
color: '#666'
}
},
series:[{
type: 'line',
name: '超载数',
data: seriesData[0]
},{
type: 'line',
name: '总数',
data: seriesData[1]
}]
}
}
this.$refs.lineCharts.init()
},
handleLineInit (canvas, width, height) {
console.log("打印表3宽高");
console.log(this.wdith);
console.log(this.height);
lineChart = echarts.init(canvas, null, {
width: width,
height: height
})
canvas.setChart(lineChart)
lineChart.setOption(this.lineOption,true)
return lineChart
},
async getChartData(typeChange) {
const body = {
stationId: this.stationId,
"access-token": this.accessToken,
type:typeChange
}
console.log(body)
const resp = await post('/station/data_statistics', body);
console.log(resp)
const { code, data } = resp;
let barXAxisData = [];
let barSeriesData = [];
let barAccessXAxisData = [];
let barAccessSeriesData = [];
let lineXAxisData = [];
let lineSeriesData = [];
let lineAccessSeriesData = [];
let lineTotalSeriesData = [];
if (code === 200) {
console.log(data)
let axleTotalNum = 0;
let axleAccessNum = 0;
let totalNum = 0;
let accessNum = 0;
// 遍历各车轴总车数
for(var k = 0, length = data.axleTotalNum.length; k < length; k++){
// 分别将对象中数据提到数组中,然后轴数给x轴,将总数给y轴
barXAxisData.push(data.axleTotalNum[k].axle)
barSeriesData.push(data.axleTotalNum[k].num)
// 把所有车轴的过车数加起来,在左上角显示过车总数
axleTotalNum = axleTotalNum + data.axleTotalNum[k].num
}
// 遍历各车轴超车数
for(var k = 0, length = data.axleAccessNum.length; k < length; k++){
barAccessXAxisData.push(data.axleAccessNum[k].axle)
barAccessSeriesData.push(data.axleAccessNum[k].num)
// 把所有车轴的超车数加起来,在右上角显示超车总数
axleAccessNum = axleAccessNum + data.axleAccessNum[k].num
}
// 遍历7日中各日过车总数
for(var k = 0, length = data.totalNum.length; k < length; k++){
//把日期存进x轴的数组
lineXAxisData.push(data.totalNum[k].day)
// 把具体每日数目存进y轴的数组
lineTotalSeriesData.push(data.totalNum[k].num)
// 统计的是7日的过车总数,其实与上面的各轴车过车总数结果一样
totalNum = totalNum + data.totalNum[k].num
}
// 遍历7日中各日超车总数
for(var k = 0, length = data.excessNum.length; k < length; k++){
console.log(k)
// 只统计y轴数据即可,因为其与7日过车数在折线图中一起显示,上面已经有x轴
lineAccessSeriesData.push(data.excessNum[k].num)
accessNum = accessNum + data.excessNum[k].num
}
console.log(lineXAxisData,barSeriesData,barAccessXAxisData,barAccessSeriesData,lineXAxisData,lineSeriesData)
// 把折线图中的两个y轴数组存到同一个数组中?
lineSeriesData.push(lineAccessSeriesData, lineTotalSeriesData);
console.log(lineXAxisData)
// 其实这4个变量是两两相等的
this.accessNum = accessNum;
this.totalNum = totalNum;
this.axleTotalNum = axleTotalNum;
this.axleAccessNum = axleAccessNum;
}
console.log(lineXAxisData, lineSeriesData)
this.initBarChart(barXAxisData, barSeriesData,typeChange)
this.initAccessBarChart(barAccessXAxisData, barAccessSeriesData,typeChange)
this.initLineChart(lineXAxisData, lineSeriesData,typeChange)
},
// tab栏切换
handleChangeTabbar(e) {
this.current = e.target.key;
console.log("按下了tab栏");
console.log(this.current);
if(this.current=="seven"){this.getChartData(7);}
else if(this.current == "month"){ this.getChartData(30);}
else if(this.current == "quarter"){this.getChartData(90)}
else if(this.current == "halfyear"){this.getChartData(180)}
else if(this.current == "year"){this.getChartData(365)}
}
}
}
</script>
<style>
.historyContainer{
width: 100%;
height: 100%;
}
.headerCard{
display: flex;
justify-content: center;
align-items: center;
flex-direction: column;
width: 100%;
height: 30px;
border: 1px solid #ccc;
margin-top: 10px;
padding-top: 10px;
padding-bottom: 10px;
font-size: 14px;
}
.wrap{
margin-top: 20px;
/* width:100%; */
width: 380px;
height: 400px;
}
.wrap1{
margin-top: 20px;
/* width:100%; */
width: 380px;
height: 400px;
margin-bottom: 50px
}
</style>


