
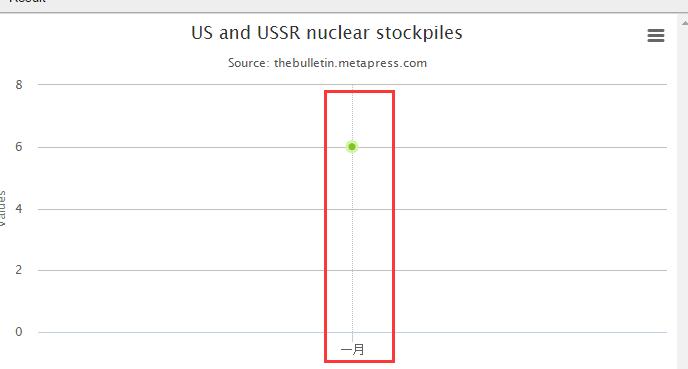
如上图所示,在higcharts区域图中,只有一个点的情况是居中显示的,设置什么参数可以让这个点靠左显示?请各位帮忙。。。。。。
附上实现的源码:
$(function () {
var categories = ['一月'];
$('#container').highcharts({
chart: {
type: 'area'
},
title: {
text: 'US and USSR nuclear stockpiles'
},
subtitle: {
text: 'Source: thebulletin.metapress.com'
},
    xAxis: {
        labels: {
                formatter: function() {
                    return categories[this.value];
                }
            },
        tickInterval:1 ,
        gridLineColor:'#c0c0c0',
        gridLineDashStyle:'Solid',
        gridLineWidth:1,
         startOnTick: true,
        min:0,
       // align:left
    },
    yAxis: {
        minPadding:0,
        startOnTick:false
    },
    tooltip: {
        pointFormat: '{series.name} produced <b>{point.y:,.0f}</b><br/>warheads in {point.x}'
    },
    plotOptions: {
        area: {
           marker:{
    symbol:'circle',
    radius:5,
    fillColor:'#87C02C',
    lineColor:'#D2F6A7',
    lineWidth: 3,
    },
        }
    },
    series: [{
        name: 'USA',
        data: [ 6
        ]
    }]
});
});


