
Problem Description
Josephina is a clever girl and addicted to Machine Learning recently. She
pays much attention to a method called Linear Discriminant Analysis, which
has many interesting properties.
In order to test the algorithm's efficiency, she collects many datasets.
What's more, each data is divided into two parts: training data and test
data. She gets the parameters of the model on training data and test the
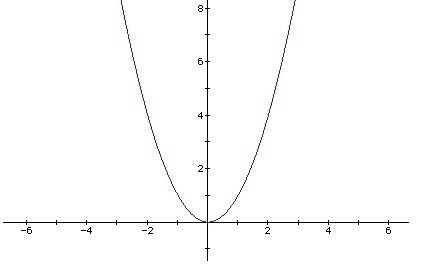
model on test data. To her surprise, she finds each dataset's test error curve is just a parabolic curve. A parabolic curve corresponds to a quadratic function. In mathematics, a quadratic function is a polynomial function of the form f(x) = ax2 + bx + c. The quadratic will degrade to linear function if a = 0.
It's very easy to calculate the minimal error if there is only one test error curve. However, there are several datasets, which means Josephina will obtain many parabolic curves. Josephina wants to get the tuned parameters that make the best performance on all datasets. So she should take all error curves into account, i.e., she has to deal with many quadric functions and make a new error definition to represent the total error. Now, she focuses on the following new function's minimum which related to multiple quadric functions. The new function F(x) is defined as follows: F(x) = max(Si(x)), i = 1...n. The domain of x is [0, 1000]. Si(x) is a quadric function. Josephina wonders the minimum of F(x). Unfortunately, it's too hard for her to solve this problem. As a super programmer, can you help her?
Input
The input contains multiple test cases. The first line is the number of cases T (T < 100). Each case begins with a number n (n ≤ 10000). Following n lines, each line contains three integers a (0 ≤ a ≤ 100), b (|b| ≤ 5000), c (|c| ≤ 5000), which mean the corresponding coefficients of a quadratic function.
Output
For each test case, output the answer in a line. Round to 4 digits after the decimal point.
Sample Input
2 1 2 0 0 2 2 0 0 2 -4 2
Sample Output
0.0000 0.5000


