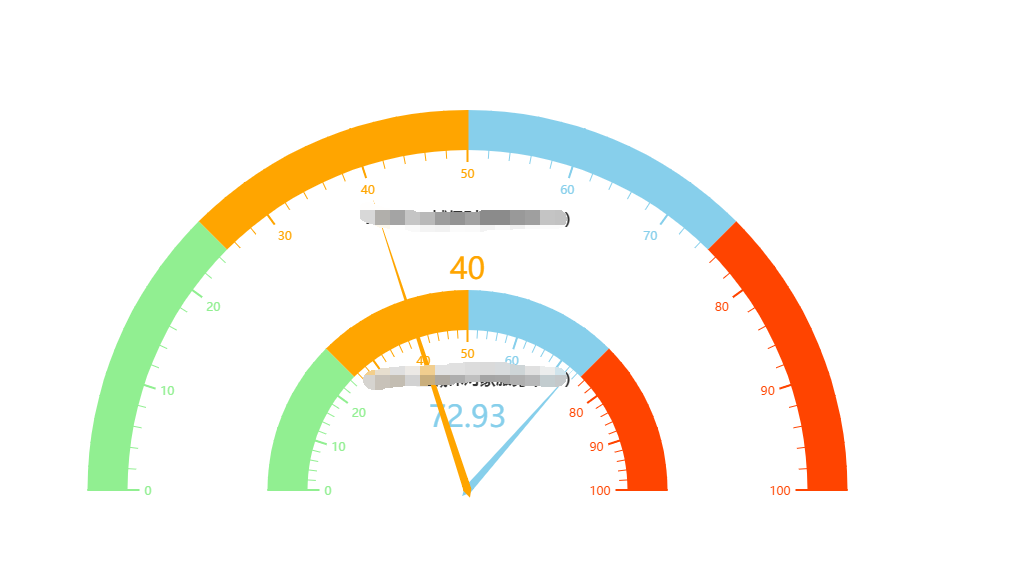
求教!怎么实现图中的仪表盘

echarts 多个仪表盘位置怎么设置

- 写回答
- 好问题 0 提建议
- 追加酬金
- 关注问题
 分享
分享- 邀请回答
-


1条回答 默认 最新
 Haven大虹 2018-12-05 03:19关注
利用center属性,例子:
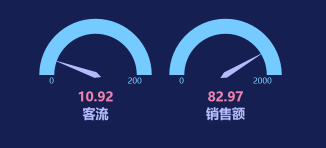
var myChart = echarts.init(document.getElementById('rateDash')); option = { tooltip: { formatter: "{a} <br/>{b} : {c}%" }, toolbox: { feature: { restore: {}, saveAsImage: {} }, show: false }, series: [ { startAngle: 180, //开始角度 左侧角度 endAngle: 0, //结束角度 右侧 type: 'gauge', center: ['15%', '50%'], //**调整仪表盘的位置** detail: { formatter: '{value}', color: '#ee83af', fontSize: 26, fontWeight: 'bolder' }, axisLine: { lineStyle: { color: [[1, '#75caff']] } }, itemStyle: { color:'#b6bcfb' }, splitLine:{ show: false }, axisTick: { show: false }, axisLabel: { show: true, fontSize: 16, distance: -10, padding: [24, 0, 0, 0], formatter: function (value) { switch (value) { case 0: return 0;//首位刻度 case 100: return 200;//末尾刻度 default: return ''; } } } , pointer: { width: 6 }, data: [{ value: 50, name: '客流'}], title: { show: true, offsetCenter: [0, '70%'], textStyle: { fontWeight: 'bolder', fontSize: 26, color: '#b6bcfb' } } }, { startAngle: 180, //开始角度 左侧角度 endAngle: 0, //结束角度 右侧 type: 'gauge', center: ['35%', '50%'], //**调整仪表盘的位置** detail: { formatter: '{value}', color: '#ee83af', fontSize: 26, fontWeight: 'bolder' }, axisLine: { lineStyle: { color: [[1, '#75caff']] } }, itemStyle: { color: '#b6bcfb' }, splitLine: { show: false }, axisTick: { show: false }, axisLabel: { show: true, fontSize: 16, distance: -10, padding: [24, 0, 0, 0], formatter: function (value) { switch (value) { case 0: return 0;//首位刻度 case 100: return 2000;//末尾刻度 default: return ''; } } }, pointer: { width: 6 }, data: [{ value: 800, name: '销售额' }], title: { show: true, offsetCenter: [0, '70%'], textStyle: { fontWeight: 'bolder', fontSize: 26, color: '#b6bcfb' } } } ] }; setInterval(function () { option.series[0].data[0].value = (Math.random() * 100).toFixed(2) - 0; option.series[1].data[0].value = (Math.random() * 100).toFixed(2) - 0; myChart.setOption(option, true); }, 2000); myChart.setOption(option, true);解决 无用评论 打赏举报 分享
- 2021-11-21 12:38回答 1 已采纳 // 在你的axisLabel里用formatter来做处理 axisLabel: { formatter: value => { return value / 1000 + 'k
- 2022-08-17 10:53回答 2 已采纳 看文档,调整各部分的粗细大小
- 2022-11-29 16:44回答 1 已采纳 设置grid的目的其实就是为了放大这个仪表盘。 但是类似仪表盘这种的图表不能使用grid来设置。要使用 radius 属性。把radius设置大一点就好了 series: [ {
- 2021-03-18 15:13记取小窗风雨夜的博客 center: ["50%", "55%"], // 仪表盘位置(圆心坐标) startAngle: 225, // 仪表盘起始角度,默认 225。圆心 正右手侧为0度,正上方为90度,正左手侧为180度。 endAngle: -45, // 仪表盘结束角度,默认 -45 clockwise: ...
- 2020-05-26 16:56回答 1 已采纳 animationDelay 初始动画的延迟,支持回调函数,可以通过每个数据返回不同的 delay 时间实现更戏剧的初始动画效果。 ``` animationDelay: function
- 2022-10-28 23:02回答 3 已采纳 <!DOCTYPE html> <html lang="en"> <head> <meta charset="UTF-8">
- 2022-12-26 10:27回答 1 已采纳
- 2020-03-21 23:00使用Echarts仪表盘加极坐标实现一个炫酷的仪表盘,表盘渐变,边缘圆角,(备份的案例) 源码:https://gitee.com/DieHunter/myCode/tree/master/Echart/PolarGauge
- 2021-09-06 10:21回答 1 已采纳 Examples - Apache ECharts ECharts, a powerful, interactive charting and visualization
- 2022-12-21 01:36回答 3 已采纳 我觉得这个也并不一定非要用echarts来实现吧。我的想法:思路1、不用echarts实现。你可以设定一个比例,比如共100人,男生60人,女生40人,这时候寻求最大公约数,以最大公约数为除数,被除数
- 2022-01-07 11:53回答 3 已采纳 axisLine: { roundCap: true, lineStyle: { width: 18, color:
- 2022-06-16 16:57天使的同类的博客 vue+echarts实现多个仪表盘图表根据echarts官网单个仪表盘修改成多个仪表盘,代码如下: 如图所示:
- 2022-02-09 11:55回答 4 已采纳 一个页面多几个容器 。多个options就行参考下面这个 给多个容器 即可 。echarts.connect 去掉即可 react中echarts让两个或多个图联动_崽崽
- 2020-10-29 13:37weixin_39900437的博客 这期我们的主要任务是学习OurwayBI数据可视化工具上的仪表盘和数字图。从作用上来说,这两个可视化图表都是用于分析展示关键指标或异常指标,且通常放在报表前端,便于浏览者一眼掌握关键指标。废话不多说,接下来就...
- 2019-11-01 18:25heyNewbie的博客 在项目中大概需要这样一个仪表盘,就去看了官网,也在博客上看了大神们的代码 上代码: <!DOCTYPE html> <html> <head> <meta charset="UTF-8"> <title>单仪表盘案例</...
- 没有解决我的问题, 去提问


悬赏问题
- ¥60 版本过低apk如何修改可以兼容新的安卓系统
- ¥25 由IPR导致的DRIVER_POWER_STATE_FAILURE蓝屏
- ¥50 有数据,怎么建立模型求影响全要素生产率的因素
- ¥50 有数据,怎么用matlab求全要素生产率
- ¥15 TI的insta-spin例程
- ¥15 完成下列问题完成下列问题
- ¥15 C#算法问题, 不知道怎么处理这个数据的转换
- ¥15 YoloV5 第三方库的版本对照问题
- ¥15 请完成下列相关问题!
- ¥15 drone 推送镜像时候 purge: true 推送完毕后没有删除对应的镜像,手动拷贝到服务器执行结果正确在样才能让指令自动执行成功删除对应镜像,如何解决?