


最近在学习 Vue-Echart 图表,现在有一个需求是:通过 V-For 动态的读取一个数组数据再生成图表,并将数组里的数据传给每个图表(title 和 value),可是如何实现将数组的每个数据依次传递给动态生成的图表呢?
<template>
  <div>
    <el-card>
      <el-row type="flex" justify="center"
        ><span style="font-size: 20px; font-weight: 700"> Wafer 统计数据</span>
      </el-row>

      <el-row type="flex" align="bottom">
        <!-- 总体货架 Loading -->
        <el-col :span="5">
          <v-chart style="height: 240px" :option="shelfSummary" autoresize />
        </el-col>
        <!-- 每个货架 Loading -->
        <el-col :span="4" v-for="(item) in shelfList" :key="item[0]">
          <div style="font-size: 12px; font-weight: 700;text-align:center">{{item[0]}}</div>
          <v-chart style="height: 180px" :option="shelf" autoresize />
        </el-col>
      </el-row>
      <el-divider></el-divider>
      <el-row>
        <!-- 每个货架具体分布 -->
        <el-col :span="24">
          <v-chart style="height: 380px" :option="shelfDetail" autoresize />
        </el-col>
      </el-row>
    </el-card>
  </div>
</template>
图表的 option 是通过计算属性得到的。
 computed: {
    shelf() {
      let shelf = {
        // 定义 title 格式
        title: {
          show: true,
          // text: "Shelf",
          textStyle: { fontSize: 12, fontWeight: 'bolder' },
          left: 'center',
        },
        series: [
          {
            type: 'gauge',
            startAngle: 180,
            endAngle: 0,
            splitNumber: 5,
            progress: {
              show: true,
              width: 10,
            },
            pointer: {
              length: '60%',
              width: 3,
            },
            axisLine: {
              lineStyle: {
                width: 10,
              },
            },
            axisTick: {
              splitNumber: 2,
              distance: -1,
              lineStyle: {
                width: 2,
                color: '#999',
              },
            },
            splitLine: {
              distance: 0,
              length: 8,
              lineStyle: {
                width: 2,
                color: '#999',
              },
            },
            axisLabel: {
              distance: 15,
              color: '#999',
              fontSize: 8,
            },
            detail: {
              width: '60%',
              offsetCenter: [0, '20%'],
              valueAnimation: true,
              formatter: function (value) {
                return '{value|' + value.toFixed(0) + '}{unit|%}'
              },
              rich: {
                value: {
                  fontSize: 12,
                  fontWeight: 'bolder',
                  color: '#777',
                },
                unit: {
                  fontSize: 14,
                  color: '#999',
                  padding: [0, 0, 0, 5],
                },
              },
            },
            data: [
              {
               value: 10,
              },
            ],
          },
        ],
      }
      return shelf
    },
数组举例:第一个为 title,第二个为需要传递进图表的 value
(2) [Array(2), Array(2), __ob__: Observer]
0: (2) ['Shelf-No.1', 0, __ob__: Observer]
1: (2) ['Shelf-No.2', 4, __ob__: Observer]
length: 2
__ob__: Observer {value: Array(2), dep: Dep, vmCount: 0}
[[Prototype]]: Array
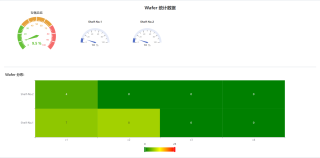
界面:
如图,上面较小的两个速度表,是可以通过 v-for 生成的,而且 title 可以通过套用一个 div 来达到动态 title 的效果,可是如何将数组的值传递进入 chart 的 :option=''shelf' 里的 data: value (现在是写死的 value: 10, )呢,查了半天,也没有找到合适的方法,特来请教。希望各位给些建议,谢谢。。


