var chart = Highcharts.chart('container1', {
chart: {
type: 'spline',
marginRight: 10,
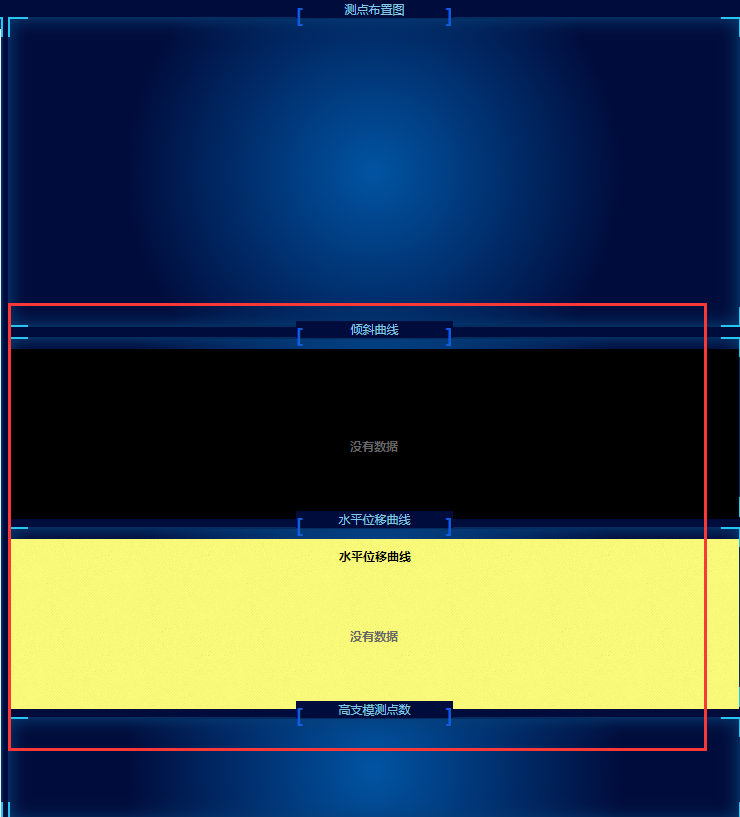
backgroundColor: 'rgba(0,0,0,0) ',
/* subtitle: {
text: document.ontouchstart === undefined ?
'鼠标拖动可以进行缩放' : '手势操作进行缩放'
}, */
events: {
load: function () {
//设置更新
var series = this.series[0];
var _this = this
setInterval(function () {
var this_=_this
selectShishi('L',_this); //这个L就是你判断的标示 也就是那个type ,也是数据库里哪个test_num
}, 1000);
}
}
},
lang: {
noData: "没有数据"
},
credits : {
enabled: false
},
time: {
useUTC: false
},
title: {
text: '立杆倾斜曲线'
},
series: {
animation: false
},
xAxis: {
type: 'datetime',
tickPixelInterval: 100
},
yAxis: {
title: {
text:''
},
plotLines: [{
value: 0,
width: 1,
color: '#808080'
}]
},
tooltip: {
formatter: function () {
return '<b>' + this.series.name + '</b><br/>' +
Highcharts.dateFormat('%Y-%m-%d %H:%M:%S', this.x) + '<br/>' +
Highcharts.numberFormat(this.y, 2);
}
},
legend: {
enabled: true,
align: 'left',//水平方向位置
verticalAlign: 'left'//垂直方向位置
},
exporting: {
enabled: false
}
});
backgroundColor: 'rgba(0,0,0,0) ', 我引号里面什么也不写也不对 百度看了很多方法都不合适 求大佬帮一下谢谢 我用的是highcharts! 谢谢!


