fig = plt.figure(figsize=(2.5, 3.53557), dpi=180)
ax1 = fig.add_subplot(711)
norma = mpl.colors.Normalize(vmin=0, vmax=40)
map = ax1.imshow(data112, interpolation='nearest', cmap=cmap, as pect='auto', norm=norma, origin='lower')
font2 = {'family': 'Times New Roman', 'weight': 'normal', 'size': 30}
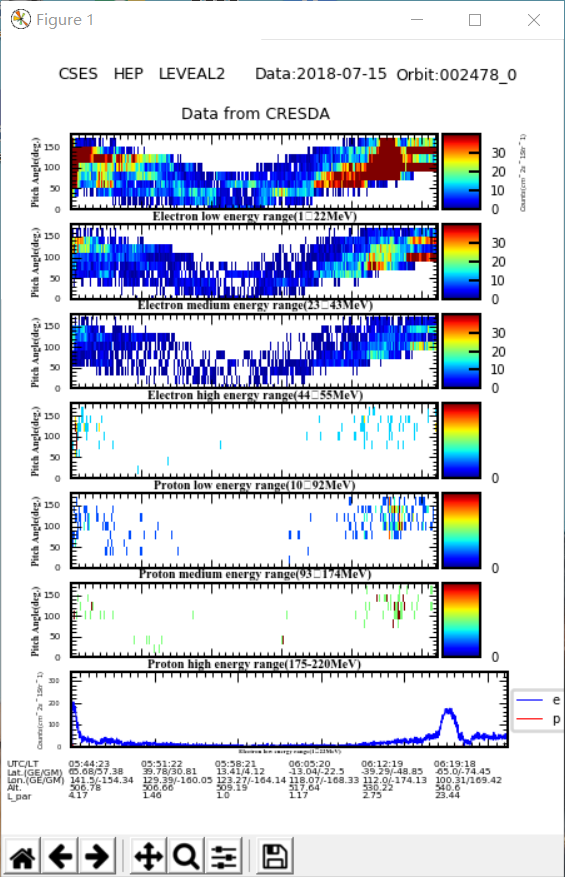
plt.xlabel('Electron low energy range(1~22MeV)', font2, fontsize=4, labelpad=0.5)
plt.ylabel('Pitch Angle(deg.)', font2, fontsize=3, labelpad=0.1)
plt.xlim(0, 262)
plt.ylim(0, 9)
cb = fig.colorbar(mappable=map, cax=None, ax=ax1, pad=0.01, aspect=2, shrink=1.0, norm=norm, ticks=[0, 10, 20, 30])
cb.set_label('$Counts(cm^-2s^-1Str^-1)$', size=2)
cb.ax.tick_params(labelsize=4, direction='in', right='True')
ax7 = fig.add_subplot(717)
ax7.plot(np.arange(0, len(Electron_counts)), Electron_counts, color='b', label='e', linewidth=0.4)
ax7.plot(np.arange(0, len(Proton_counts)), Proton_counts, color='r', label='p', linewidth=0.4)
plt.legend(bbox_to_anchor=(1.01, 0.5), loc=6, borderaxespad=0, fontsize=4)
font2 = {'family': 'Times New Roman', 'weight': 'normal', 'size': 30}
 plt.xlabel('Electron low energy range(1~22MeV)', font2, fontsize=2, labelpad=0.5)
plt.xlim(0, 262)
plt.ylim(0, 340)
plt.ylabel('$Counts(cm^-2s^-1Str^-1)$', font2, fontsize=2, labelpad=0.5)
plt.yticks([0, 100, 200, 300], ['0', '100', '200', '300'])
plt.show()