
    plt.plot(input_[output == 1, -2],input_[output == 1, -1],"bx", linewidth = 2)
    plt.plot(input_[output == 0, -2], input_[output ==0, -1],"go", linewidth = 2)
######有关numpy 库的问题
######在logistics regression中, 画desion boundary时候用到的。input 是一个倆维arrary由x_1和x_2 组成
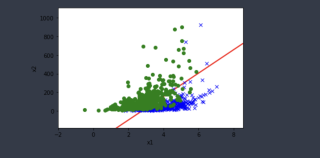
画出来的图像如下所示
######不理解input_[output == 0, -2], input_[output ==0, -1]的作用


