
使用echarts折线图,给title设置样式的时候,发现backgroundColor不起作用,不知道是哪里出了问题,希望熟悉echarts的大牛能指点下,不胜感激!
我的代码效果图如下: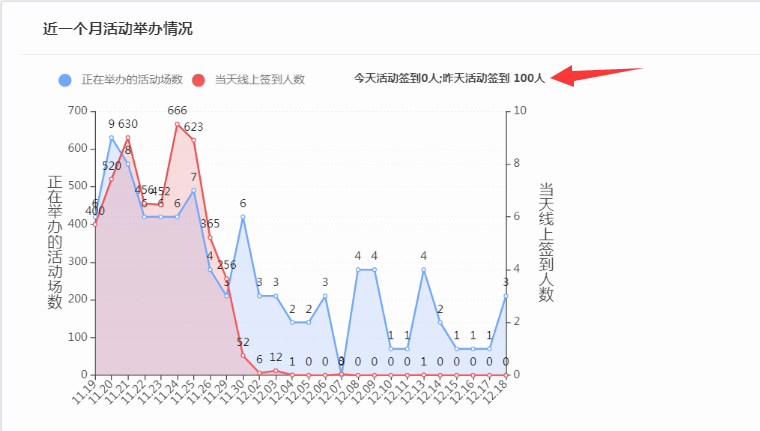
想要实现的是箭头所指部分给加一个背景色,参考文档:
https://www.echartsjs.com/zh/option.html#title.backgroundColor
我的配置项如下:
areaOption: {
title: {
text:'今天活动签到0人;昨天活动签到 100人',
backgroundColor:'#649FFF',
show:true,
left: 'right',//这个太神奇了,设置标题居中的.
padding:20,
textStyle: {
fontSize: 12,
align: 'center',
},
},
legend: { // 图例 data: ['正在举办的活动场数', '当天线上签到人数',]
show:true,
padding:20,
left:20,
data: [
{
name:'正在举办的活动场数',
icon:'circle',
textStyle:{
color:'#666666',
fontSize: 12,
}
},
{
name: '当天线上签到人数',
icon:'circle',
textStyle:{
color:'#666666',
fontSize: 12,
}
},
]
},
grid: {
top: 60,
right: 40,
bottom: 20,
left: 50,
containLabel: true
},
tooltip: {
trigger: 'axis',//坐标轴触发
snap: true, //坐标轴指示器是否自动吸附到点上
confine: true,//是否将 tooltip 框限制在图表的区域内
axisPointer: {
type: 'cross',
label: {
backgroundColor: '#6a7985',
shadowColor: '#42515d',
formatter: '{value}' //显示x轴的值
},
},
//formatter: "{value}<br/> {a0} <br/>{b} : {c}次"
},
xAxis: [
{
type: 'category',
boundaryGap: false,
// data : ['1月','2月','3月','4月','5月','6月','7月','8月','9月','10月','11月','12月']
data: [],
axisLabel: {//刻度相关
interval: 0,
rotate: 45,
}
}
],
yAxis: [
{
type: 'value',
name: "正\n在\n举\n办\n的\n活\n动\n场\n数",
nameLocation: "center",
nameGap: 35,
nameRotate: 0,
nameTextStyle: {
fontSize: 16,
},
splitLine: {
show: true,
lineStyle:{
type:'dotted',
opacity:0.2
},
},
minInterval: 1, //设置成1保证坐标轴分割刻度显示成整数。
axisLabel: {
formatter: function (v) {
return parseInt(v); //0表示小数为0位,1表示1位小数,2表示2位小数
}
},
axisPointer: {
show: true,
label: {
show: true,
precision: 0 //这个用来控制y轴小数点精度
}
},
},
{
type: 'value',
name: "当\n天\n线\n上\n签\n到\n人\n数",
nameLocation: "center",
nameGap: 35,
nameRotate: 0,
nameTextStyle: {
fontSize: 16,
},
splitLine: {
show: true,
lineStyle:{
type:'dotted',
opacity:0.2
},
},
minInterval: 1,
axisLabel: {
formatter: function (v) {
return v.toFixed(0); //0表示小数为0位,1表示1位小数,2表示2位小数
}
},
axisPointer: {
show: true,
label: {
show: true,
precision: 0 //这个用来控制y轴小数点精度
}
},
}
],
series: [
{
name: '正在举办的活动场数',
type: 'line',
// smooth: true,
yAxisIndex: 1,
areaStyle: {normal: {opacity: 0.2}},//设置透明度
data: [],
// data:[16,16,6,5,4,4,3,0,0,0,0,0],
itemStyle: {normal: {label: {show: true}}},
//color: ['#E04445'],
color: [
{
type: 'linear',
x: 0,
y: 0,
x2: 0,
y2: 1,
colorStops: [{
offset: 0, color: '#649FFF' // 0% 处的颜色
}, {
offset: 1, color: '#649fff' // 100% 处的颜色
}],
globalCoord: true // 缺省为 false
}
],
connectNulls: true,
// clip:false
},
{
name: '当天线上签到人数',
type: 'line',
// smooth: true,
yAxisIndex: 0,
areaStyle: {normal: {opacity: 0.2}},//设置透明度
data: [],
// data:[35,15,8,12,11,6,3,0,0,0,0,0],
itemStyle: {normal: {label: {show: true}}},
// color: ['#649FFF'],
color: [
{
type: 'linear',
x: 0,
y: 0,
x2: 0,
y2: 1,
colorStops: [{
offset: 0, color: '#E04445' // 0% 处的颜色
}, {
offset: 1, color: '#ff494a' // 100% 处的颜色
}],
globalCoord: true // 缺省为 false
}
],
connectNulls: true,
}
]
},


