1. 项目架构
前端:bootstap
数据可视化:echart中的share dataset图型
后端:tornado
数据库:mongodb
2. 问题:
想要实现从mongodb数据库实时采集数据,传给前端的echart。
请教,前端怎么接数据,后端通过什么传数据
具体怎么实现不太会
3. 代码
html页面代码test.html(静态有数据)
<!DOCTYPE html>
<html>

    <head>
        <meta charset="utf-8">
        <title>ECharts</title>
        <!-- 引入 echarts.js -->
        <script src="{{static_url('js/echarts.min.js')}}"></script>
    </head>

    <body>
        <!-- 为ECharts准备一个具备大小(宽高)的Dom -->
        <div id="main" style="width: 1400px;height:700px;"></div>
        <script type="text/javascript">
        <script type="text/javascript">
                // 基于准备好的dom,初始化echarts实例
                    var myChart = echarts.init(document.getElementById('main'));
                                var option;
                                setTimeout(function () {

                                    option = {
                                        legend: {},
                                        tooltip: {
                                        trigger: 'axis',
                                        showContent: false
                                    },
                                    dataset: {
                                        source: [
                                            ['product', '2019-11', '2019-12', '2020-01' ],
                                            ['ftp', 86, 31, 28],
                                            ['http', 15, 19, 7],
                                            ['ssh', 24, 67, 18],
                                            ['telnet', 65, 67, 0],
                                            ['portscan', 56, 28, 28],
                                            ['mysql', 25, 37, 27],
                                            ['git', 1, 2, 11],
                                            ['ntp', 3, 0, 0],
                                            ['redis', 15, 2, 0],
                                            ['tcpbanner', 3, 1, 0],
                                            ['vnc', 15, 19, 0],
                                            ['rdp', 7, 6, 0],
                                            ['snmp', 31, 15, 7],
                                            ['sip', 4, 0, 0, ],
                                            ['mssql', 27, 10, 0, ],
                                            ['httpproxy', 14, 11, 0],


                                        ]
                                    },
                                    xAxis: {type: 'category'},
                                    yAxis: {gridIndex: 0},
                                    grid: {top: '55%'},
                                    series: [
                                        {type: 'line', smooth: true, seriesLayoutBy: 'row'},
                                        {type: 'line', smooth: true, seriesLayoutBy: 'row'},
                                        {type: 'line', smooth: true, seriesLayoutBy: 'row'},
                                        {type: 'line', smooth: true, seriesLayoutBy: 'row'},
                                        {type: 'line', smooth: true, seriesLayoutBy: 'row'},
                                        {type: 'line', smooth: true, seriesLayoutBy: 'row'},
                                        {type: 'line', smooth: true, seriesLayoutBy: 'row'},
                                        {type: 'line', smooth: true, seriesLayoutBy: 'row'},
                                        {type: 'line', smooth: true, seriesLayoutBy: 'row'},
                                        {type: 'line', smooth: true, seriesLayoutBy: 'row'},
                                        {type: 'line', smooth: true, seriesLayoutBy: 'row'},
                                        {type: 'line', smooth: true, seriesLayoutBy: 'row'},
                                        {type: 'line', smooth: true, seriesLayoutBy: 'row'},
                                        {type: 'line', smooth: true, seriesLayoutBy: 'row'},
                                        {type: 'line', smooth: true, seriesLayoutBy: 'row'},
                                        {type: 'line', smooth: true, seriesLayoutBy: 'row'},

                                        {
                                            type: 'pie',
                                            id: 'pie',
                                            radius: '30%',
                                            center: ['50%', '30%'],
                                            label: {
                                                formatter: '{b}: {@2012} ({d}%)'
                                            },
                                            encode: {
                                                itemName: 'product',
                                                value: '2012',
                                                tooltip: '2012'
                                            }
                                        }
                                    ]
                                };

                                myChart.on('updateAxisPointer', function (event) {
                                    var xAxisInfo = event.axesInfo[0];
                                    if (xAxisInfo) {
                                        var dimension = xAxisInfo.value + 1;
                                        myChart.setOption({
                                            series: {
                                                id: 'pie',
                                                label: {
                                                    formatter: '{b}: {@[' + dimension + ']} ({d}%)'
                                                },
                                                encode: {
                                                    value: dimension,
                                                    tooltip: dimension
                                                }
                                            }
                                        });
                                    }
                                });

                                myChart.setOption(option);

                            });
                                myChart.setOption(option);
        </script>
    </body>
</html>
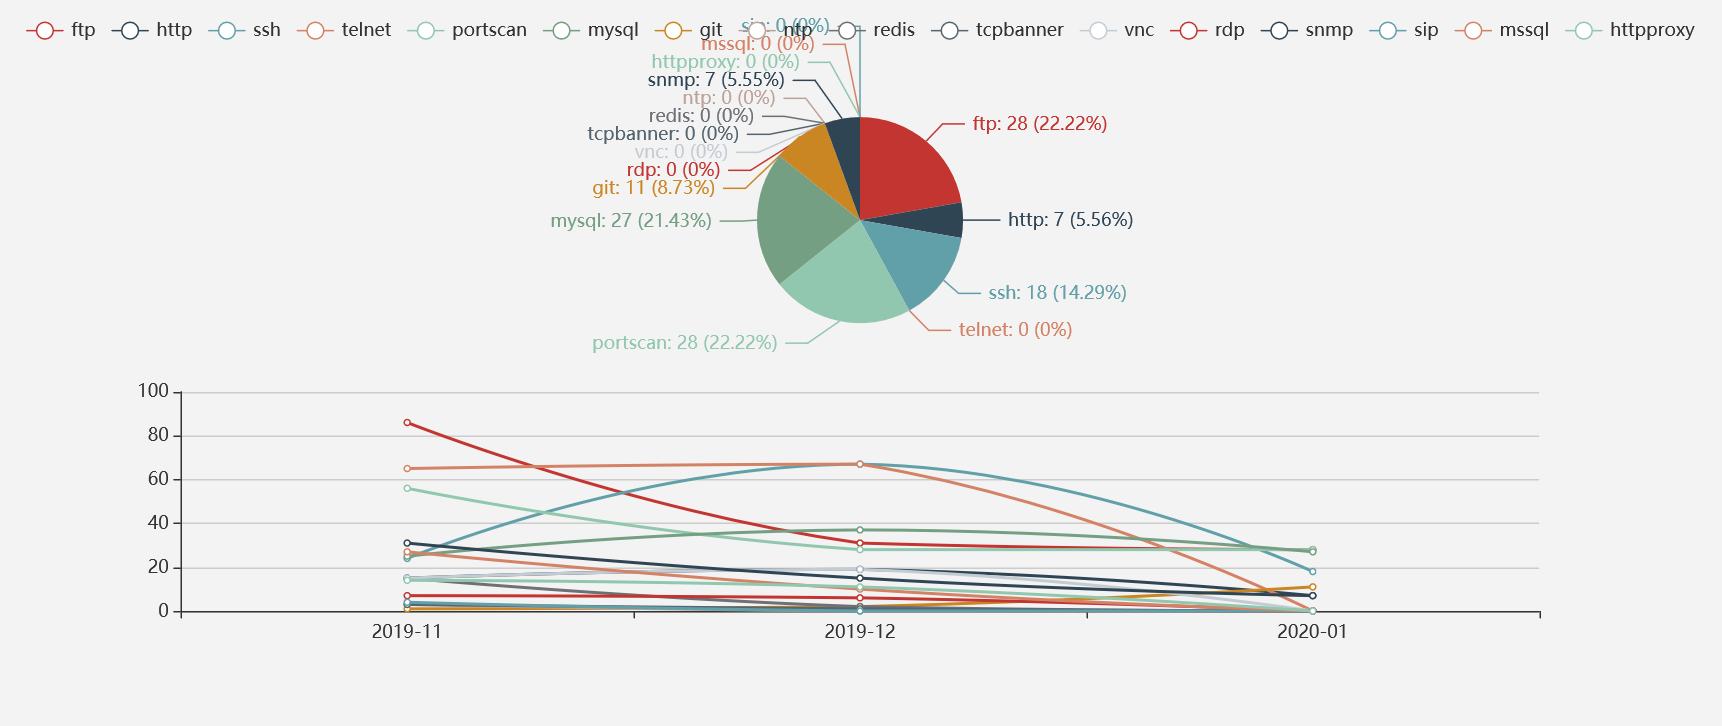
4. test.html显示效果图