
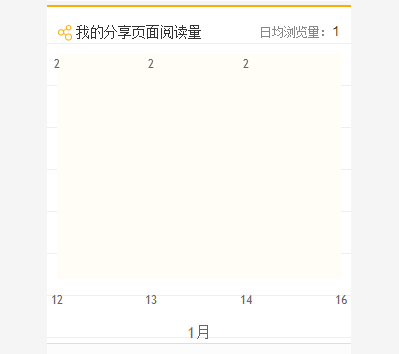
10以下是这样的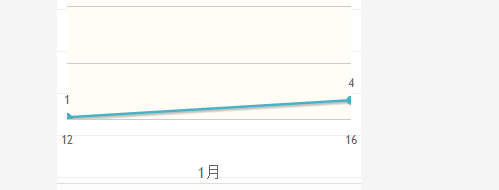
一下是代码
$.jqplot.config.enablePlugins = true;
var plot1 = $.jqplot('chart2', taskArr2, {
axes : {
xaxis : {
renderer:jQuery.jqplot.LinearAxisRenderer,
tickOptions : {
mark : 'outside',
showMark : false,
showGridline : false,
showLabel : true,
markSize : 4,
angle: -30
},
label : selectMonth,
show : false,
ticks : taskDateArr2,
showTickMarks : true
},
yaxis : {
show : false,
showTicks : false,
showGridline : false,
showTickMarks : true
}
},
        highlighter : {
            tooltipAxes : 'y'
        },
        markerRenderer: $.jqplot.MarkerRenderer,
        markerOptions : {
            show : true,
            size: 5,
        style: 'diamond'
        }

        ,
        grid : {
            drawGridLines : false, // wether to draw lines across the grid or not.
            gridLineColor : '#cccccc', // 设置整个图标区域网格背景线的颜色
            background : '#fffdf6', // 设置整个图表区域的背景色
            borderColor : '#999999', // 设置图表的(最外侧)边框的颜色
            borderWidth : 0.0, //设置图表的(最外侧)边框宽度
            shadow : false, // 为整个图标(最外侧)边框设置阴影,以突出其立体效果
            shadowAngle : 45, // 设置阴影区域的角度,从x轴顺时针方向旋转
            shadowOffset : 1.5, // 设置阴影区域偏移出图片边框的距离
            shadowWidth : 3, // 设置阴影区域的宽度
            shadowDepth : 3, // 设置影音区域重叠阴影的数量
            shadowAlpha : 0.07
        // 设置阴影区域的透明度
        }

    })
}


