option = {
title: {
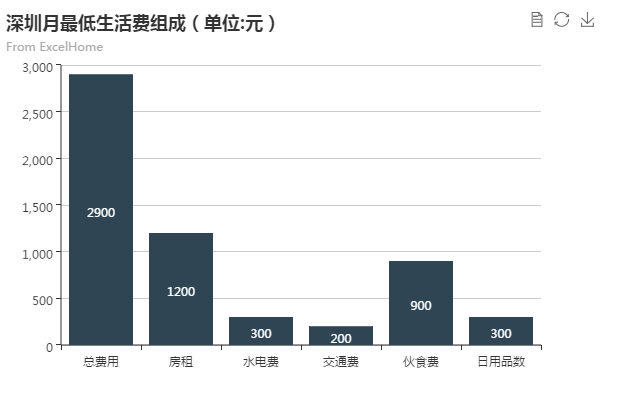
text: '深圳月最低生活费组成(单位:元)',
subtext: 'From ExcelHome',
sublink: 'http://e.weibo.com/1341556070/AjQH99che'
},
tooltip : {
trigger: 'axis',
axisPointer : { // 坐标轴指示器,坐标轴触发有效
type : 'shadow' // 默认为直线,可选为:'line' | 'shadow'
},
formatter: function (params) {
var tar = params[0];
return tar.name + '
' + tar.seriesName + ' : ' + tar.value;
}
},
toolbox: {
show : true,
feature : {
mark : {show: true},
dataView : {show: true, readOnly: false},
restore : {show: true},
saveAsImage : {show: true}
}
},
xAxis : [
{
type : 'category',
splitLine: {show:false},
data : ['总费用','房租','水电费','交通费','伙食费','日用品数']
}
],
yAxis : [
{
type : 'value'
}
],
series : [
{
name:'辅助',
type:'bar',
stack: '总量',
itemStyle:{
normal:{
barBorderColor:'rgba(0,0,0,0)',
color:'rgba(0,0,0,0)'
},
emphasis:{
barBorderColor:'rgba(0,0,0,0)',
color:'rgba(0,0,0,0)'
}
},
data:[0, 1700, 1400, 1200, 300, 0]
},
{
name:'生活费',
type:'bar',
stack: '总量',
itemStyle : { normal: {label : {show: true, position: 'inside'}}},
data:[2900, 1200, 300, 200, 900, 300]
}
]
};

百度echarts官方实例动态数据怎么跑起来?一直粘贴官方代码,就是跑不起来。

- 写回答
- 好问题 0 提建议
- 追加酬金
- 关注问题
 分享
分享- 邀请回答
-


1条回答 默认 最新
 Sam_qifa 2016-03-21 07:26关注
帮你调了一下,可以跑起来的。
你应该是某些格式弄错。使用下面这个吧。
<!DOCTYPE html> <html> <head> <meta charset="utf-8"/> <!-- import Echarts --> <script src="echarts.js"></script> </head> <body> <!-- prepare the Dom for ECharts --> <div id="main" style="width: 600px; height:400px;"></div> <script type="text/javascript"> //base on the dom to init the echarts instance var myChart = echarts.init(document.getElementById("main")); //init the config and data /** var option = { title: { text: 'ECharts Sample' }, tooltip:{}, legend: { data:['销量'] }, xAxis: { data:["衬衫","羊毛衫","雪纺衫","裤子","高跟鞋","袜子"] }, yAxis: {}, series: [{ name:'销量', type:'bar', data:[5,20,36,10,10,20] }] }; **/ var option = { title: { text: '深圳月最低生活费组成(单位:元)', subtext: 'From ExcelHome', sublink: 'http://e.weibo.com/1341556070/AjQH99che' }, tooltip : { trigger: 'axis', axisPointer : { // 坐标轴指示器,坐标轴触发有效 type : 'shadow' // 默认为直线,可选为:'line' | 'shadow' } }, formatter: function (params) { var tar = params[0]; return tar.name + ' ' + tar.seriesName + ' : ' + tar.value; }, toolbox: { show : true, feature : { mark : {show: true}, dataView : {show: true, readOnly: false}, restore : {show: true}, saveAsImage : {show: true} } }, xAxis : { type : 'category', splitLine: {show:false}, data : ['总费用','房租','水电费','交通费','伙食费','日用品数'] }, yAxis : { type : 'value' } , series : [ { name:'辅助', type:'bar', stack: '总量', itemStyle:{ normal:{ barBorderColor:'rgba(0,0,0,0)', color:'rgba(0,0,0,0)' }, emphasis:{ barBorderColor:'rgba(0,0,0,0)', color:'rgba(0,0,0,0)' }, data:[0, 1700, 1400, 1200, 300, 0] } }, { name:'生活费', type:'bar', stack: '总量', itemStyle : { normal: {label : {show: true, position: 'inside'}}}, data:[2900, 1200, 300, 200, 900, 300] } ] }; //use the config and data to show the chart myChart.setOption(option); </script> </body> </html>解决 无用评论 打赏举报 分享
- 2015-05-24 14:30回答 3 已采纳 我觉得你没理解echarts的机制,可以多读读源码。 下面这样,无非实现一个动态更新数据。 ``` ```
- 2020-10-31 14:41回答 1 已采纳 这个很简单的啊,把你后台的返回数据赋值到你的 data里就可以了啊, orient: {"center", left: 1100, top:120,
- 2021-12-31 10:12回答 4 已采纳 可能跟注册有关
- 2021-05-02 11:54SimpleUmbrella的博客 作者:文兄 ...来源:知乎 著作权归作者所有。商业转载请联系作者获得授权,非商业转载请...地图数据可视化工具(7个)7.金融(股票)数据可视化工具(2个)8.时间轴数据可视化工具(2个)9.函数与公式数据可视化工具(2个
- 2021-08-22 13:32回答 1 已采纳 把执行的方法放在created()里 created() { this.getStatistic() this.$nextTick(() => { this.dr
- 2022-04-05 19:12回答 2 已采纳 看控制台有什么报错没有
- 2022-05-08 16:13回答 2 已采纳 你把this.drawChart()放在 getData方法请求成功之后,赋值完的地方
- 2022-07-11 10:17satuo@的博客 1 3 原声 js ECMASCRIPT ES3 ES5 ES6 ES… 严格区分大小写 基础知识 变量:存储数据的容器 var ind=$(‘.list li’).index() 声明 必须使用var声明变量 一般不能重复声明 赋值: = js 命名规范: 语义化 只能以字母...
- 2021-07-23 15:30回答 5 已采纳 使用v-if控制组件,未获取到数据之前将v-if设置为false,获取到数据后设置为true //html <div id='echart' v-if='isShow'></div&
- 2022-01-19 14:28回答 2 已采纳 看了一下,你这个二维数组只有城市信息没有数据啊;如果你要拼接echarts 数据是你图中的{name:"",value:""}就直接循环你第一层数组,拿到 的item,就是第二层数组,根据下标去拿值;
- 2022-05-07 14:56回答 2 已采纳 浏览器F12打开控制台看看数据获取到了没,或者是js报了什么错误。 //这里是不是应该option.series ? options.series = o
- 2022-04-28 17:19Mtao&的博客 Vue.config.productionTip=false //阳止 vue在启动时生成生产提示。...使用 debugger 语句类似于在代码中设置断点。 通常,你可以通过按下 F12 开启调试工具, 并在调试菜单中选择 "Console" 。 注意:
- 2022-04-10 23:19回答 1 已采纳 注意看这个:"TypeError: Cannot read properties of undefined (reading 'getAttribute')" 。看看你getAttribute方法有
- 2021-05-16 21:11十九万里的博客 该项目是在年初的时候学习黑马程序员vue项目实战整理的笔记,自用的所有比较乱 文章比较长但省去了看视频的时间,...需要源代码和接口文档软件的同学可私聊我!! 项目结构 : 1.项目初始化 2.登录和退出功能 3.主.
- 2022-07-16 15:10风吟Pro的博客 对接口信息进行管理,测试一条龙服务非常快乐因为Swagger组件是公共的,所以单独拿一个模块做Common-serviceUtils模块依赖我就不多说了,具体路径可以看这个注意,common包下及其子模块作为一个单独的子模块,是无法...
- 没有解决我的问题, 去提问


悬赏问题
- ¥15 有人知道怎么将自己的迁移策略布到edgecloudsim上使用吗?
- ¥15 错误 LNK2001 无法解析的外部符号
- ¥50 安装pyaudiokits失败
- ¥15 计组这些题应该咋做呀
- ¥60 更换迈创SOL6M4AE卡的时候,驱动要重新装才能使用,怎么解决?
- ¥15 让node服务器有自动加载文件的功能
- ¥15 jmeter脚本回放有的是对的有的是错的
- ¥15 r语言蛋白组学相关问题
- ¥15 Python时间序列如何拟合疏系数模型
- ¥15 求学软件的前人们指明方向🥺