想画一个如图样子的散点图,div的宽为144.8,高为166,请问应该在哪些地方做哪些修改,能提供修改后的代码是最好了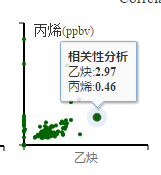

关于highcharts散点图的问题

- 写回答
- 好问题 0 提建议
- 追加酬金
- 关注问题
 分享
分享- 邀请回答
-


3条回答 默认 最新
 爱看夜的猫 2017-03-06 05:51关注
$(function () {
$('#div的id').highcharts({ chart: { type: 'scatter', zoomType: 'xy' }, title: { text: '主标题(不要可去掉)' }, subtitle: { text: '子标题(不要可去掉)' }, xAxis: { title: { enabled: true, text: 'x轴名称' }, startOnTick: true, endOnTick: true, showLastLabel: true }, yAxis: { title: { text: 'Y轴名称' } }, legend: { layout: 'vertical', align: 'left', verticalAlign: 'top', x: 100, y: 70, floating: true, backgroundColor: (Highcharts.theme && Highcharts.theme.legendBackgroundColor) || '#FFFFFF', borderWidth: 1 }, plotOptions: { scatter: { marker: { radius: 5, states: { hover: { enabled: true, lineColor: 'rgb(100,100,100)' } }解决 无用评论 打赏举报 分享
- 2019-03-25 11:33回答 1 已采纳 试下,看是否是浏览器问题
- 2022-01-17 18:52回答 1 已采纳 lenged 应该可以设置 吧 Documentation - Apache ECharts ECharts, a powerful, i
- 2014-05-20 22:50回答 1 已采纳 Because you should set multiple array of series in series object, but you have a single serie: cur
- 2021-12-14 14:19obj_null的博客 折线图,画完,发现设置max值,但数据里面同时有多个数据为max值,连接起来得线会只显示一半
- 2016-04-26 11:51回答 1 已采纳 http://zhaowenbinmail.blog.163.com/blog/static/39080862012111103532746/
- 2017-05-24 03:23回答 3 已采纳 echarts ,配置好 ,--> 官方教程,直接复制粘贴的,数据的增多,平移,设置series里面的data 数组 ,push shift,对数组修改,setOption 就能实现上述效果.
- 2017-06-01 01:05回答 2 已采纳 你是要时间为横坐标,name为highcharts里series节电里的name ,pjcj为date数据数组是吧。 可以这样 1、 组建x轴数据,将其封装成list数组; 根据查询条件构造
- 2023-12-12 08:56mountainariver的博客 设置series时设置dashStyle: 'dot'即可设置折线。
- 2015-05-28 02:05回答 2 已采纳 放你ajax的回调里面执行 chart = new Highcharts.Chart({构造。。 要不将你的ajax改为同步执行的,不能异步,要不你的inc赋值后于Highcharts.Char
- 2017-12-03 09:09回答 2 已采纳 设置dataLabels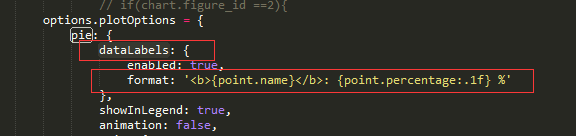
- 2017-11-16 02:52回答 1 已采纳 参考,你试试里面的softMin,,https://api.hcharts.cn/highcharts#yAxis
- 2020-08-06 16:01美好即将发生的博客 HTML <div id="quxcontainer"></div> JS $('#quxcontainer').highcharts({ chart: { type: 'spline', backgroundColor: '#2E3549', }, credits: { enabled: false }, title: {
- 2015-08-01 01:29回答 2 已采纳 自己也能采纳自己? 自己也能采纳自己? 自己也能采纳自己?
- 2020-04-30 10:45LiMay4的博客 var chart = Highcharts.chart('container',{ chart: { type: 'column' }, title: { text: '月平均降雨量' }, subtitle: { text: '数据来源: WorldClimate.com' }, xAxis...
- 2019-04-03 17:15沙振宇的博客 想要在Web网页上,做折线图,柱形图等。查了一些开源的项目,发现Highcharts框架还是很好用,于是做了一个小示例,供大家共同学习。Highcharts的官网:https://www.highcharts.com/Highcharts的官网的api文档:...
- 没有解决我的问题, 去提问

