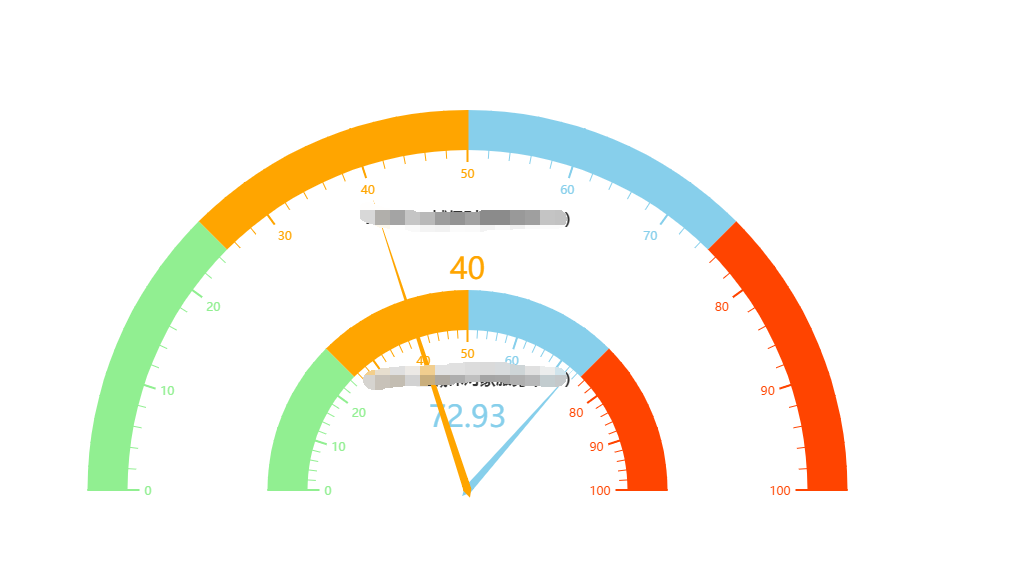
求教!怎么实现图中的仪表盘

echarts 多个仪表盘位置怎么设置

- 写回答
- 好问题 0 提建议
- 关注问题
 分享
分享- 邀请回答
-

1条回答 默认 最新
 Haven大虹 2018-12-05 03:19关注
利用center属性,例子:
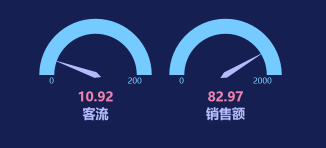
var myChart = echarts.init(document.getElementById('rateDash')); option = { tooltip: { formatter: "{a} <br/>{b} : {c}%" }, toolbox: { feature: { restore: {}, saveAsImage: {} }, show: false }, series: [ { startAngle: 180, //开始角度 左侧角度 endAngle: 0, //结束角度 右侧 type: 'gauge', center: ['15%', '50%'], //**调整仪表盘的位置** detail: { formatter: '{value}', color: '#ee83af', fontSize: 26, fontWeight: 'bolder' }, axisLine: { lineStyle: { color: [[1, '#75caff']] } }, itemStyle: { color:'#b6bcfb' }, splitLine:{ show: false }, axisTick: { show: false }, axisLabel: { show: true, fontSize: 16, distance: -10, padding: [24, 0, 0, 0], formatter: function (value) { switch (value) { case 0: return 0;//首位刻度 case 100: return 200;//末尾刻度 default: return ''; } } } , pointer: { width: 6 }, data: [{ value: 50, name: '客流'}], title: { show: true, offsetCenter: [0, '70%'], textStyle: { fontWeight: 'bolder', fontSize: 26, color: '#b6bcfb' } } }, { startAngle: 180, //开始角度 左侧角度 endAngle: 0, //结束角度 右侧 type: 'gauge', center: ['35%', '50%'], //**调整仪表盘的位置** detail: { formatter: '{value}', color: '#ee83af', fontSize: 26, fontWeight: 'bolder' }, axisLine: { lineStyle: { color: [[1, '#75caff']] } }, itemStyle: { color: '#b6bcfb' }, splitLine: { show: false }, axisTick: { show: false }, axisLabel: { show: true, fontSize: 16, distance: -10, padding: [24, 0, 0, 0], formatter: function (value) { switch (value) { case 0: return 0;//首位刻度 case 100: return 2000;//末尾刻度 default: return ''; } } }, pointer: { width: 6 }, data: [{ value: 800, name: '销售额' }], title: { show: true, offsetCenter: [0, '70%'], textStyle: { fontWeight: 'bolder', fontSize: 26, color: '#b6bcfb' } } } ] }; setInterval(function () { option.series[0].data[0].value = (Math.random() * 100).toFixed(2) - 0; option.series[1].data[0].value = (Math.random() * 100).toFixed(2) - 0; myChart.setOption(option, true); }, 2000); myChart.setOption(option, true);解决 无用评论 打赏举报 分享
- 2025-03-13 09:16ECharts 是一个使用 JavaScript 实现的开源可视化库,它可以在网页上创建各种各样的图表。ECharts 仪表盘是该库中...无论是用于商业报告、网站后台监控,还是用于个人项目的展示,ECharts 仪表盘都是一个很好的选择。
- 2024-12-27 09:28这一功能允许我们在一个仪表盘中展示多个数据指标,这对于需要同时监测多个关键绩效指标(KPI)的用户来说非常实用。仪表盘通常用于企业大屏的可视化展示,它们能够通过简洁直观的方式将复杂的数据信息快速传达给观众...
- 2025-03-13 09:16这暗示了该压缩包可能包含了创建一个仪表盘风格图表的所有必要组件和脚本。 从文件名称“ECharts仪表盘-仪表盘29.zip”中,我们可以推断出这个压缩包主要关注的是仪表盘图表的实现。仪表盘图表是一种用于展示特定...
- 2025-03-13 09:13在ECharts中,创建一个仪表盘图表主要依赖于其提供的仪表盘图表类型(gauge)。开发者可以通过设置图表的配置项来定义仪表盘的样式、范围、进度条的宽度、指针的样式等。ECharts的仪表盘可以配置多个指针(针)和多...
- 2025-03-13 09:13ECharts仪表盘的制作和应用是一个涉及到前端技术、数据可视化设计和用户体验等多个方面的复杂过程。通过不断实践和学习,开发者可以制作出既美观又实用的仪表盘,将其应用于各种数据展示场景中。同时,随着前端技术...
- 2025-03-13 09:13同时,ECharts支持多种图表组件的联动操作,这意味着可以将一个仪表盘与另一个图表的数据交互起来,实现更为复杂的数据可视化展示。 ECharts仪表盘的优化也是其一大亮点。它在保证丰富功能和良好交互体验的同时,还...
- 2025-03-13 09:131. 配置数据源:确定仪表盘所需要展示的数据,比如数值、分类等,并将其设置在ECharts的配置项中。 2. 设定范围:在仪表盘的配置中指定数据的最大值和最小值,这决定了表盘上数值的边界。 3. 自定义样式:ECharts...
- 2025-03-13 09:13在ECharts的仪表盘配置中,可以通过一个名为`series`的数组来定义数据和样式,其中每个仪表盘的配置项都是`series`数组的一个元素。每个元素可以通过`type`属性指定为`'gauge'`来表示这是一个仪表盘图表。在`gauge`...
- 2025-03-13 09:16此外,ECharts还支持主题切换,这意味着同一个仪表盘可以根据不同的主题展示不同的视觉效果,从而在不同的报告或演示中传达不同的氛围。 仪表盘通常适用于企业级的仪表板应用、个人数据监控、实时数据展示等多种...
- 2025-03-13 09:13仪表盘是ECharts库中的一个图表组件,通常用于展示一个或多个关键性能指标(KPIs)。仪表盘图表能够以直观的方式反映出数据的当前状态和目标值,非常适合用于数据监控和报表展示。 具体来说,ECharts仪表盘可以通过...
- 没有解决我的问题, 去提问
