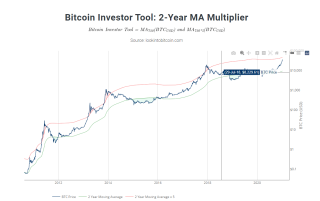
用echarts搞个类似于https://www.lookintobitcoin.com/charts/bitcoin-investor-tool/ 这样的图表;
Json地址:http://api.btc126.cn/lookintobitcoin.php?from=2YearMA
json已经加header("Access-Control-Allow-Origin: *");可以直接调用。

用echarts搞个类似于https://www.lookintobitcoin.com/charts/bitcoin-investor-tool/ 这样的图表;
Json地址:http://api.btc126.cn/lookintobitcoin.php?from=2YearMA
json已经加header("Access-Control-Allow-Origin: *");可以直接调用。
 分享
分享 <!DOCTYPE html>
<html>
<head>
<meta charset="utf-8">
<title>ECharts</title>
<!-- 引入 echarts.js -->
<script src="https://apps.bdimg.com/libs/jquery/2.1.4/jquery.min.js"></script>
<script src="https://cdn.jsdelivr.net/npm/echarts@5.0.0/dist/echarts.min.js"></script>
</head>
<body>
<!-- 为ECharts准备一个具备大小(宽高)的Dom -->
<div id="main" style="width: 600px;height:400px;"></div>
<script type="text/javascript">
// 基于准备好的dom,初始化echarts实例
var myChart = echarts.init(document.getElementById("main"));
$.getJSON('https://api.btc126.cn/lookintobitcoin.php?from=2YearMA', function(data) {
const a = data.props.children[0].props.figure.data;
// console.log('a', a)
var option = {
title: {
text: '大标题',
subtext: '副标题',
left: 'center'
},
tooltip: {
trigger: 'axis',
axisPointer: {
type: 'line',
label: {
backgroundColor: '#6a7985'
}
},
formatter: function(params) {
// console.log(params)
// 这里自己调整
return params[0].name
}
},
legend: {
left: '2%',
bottom: '0%',
data: [a[4].name, a[2].name, a[0].name]
},
toolbox: {
show: true,
feature: {
dataZoom: {
yAxisIndex: 'none'
},
dataView: {
readOnly: false
},
restore: {},
saveAsImage: {}
}
},
xAxis: {
type: 'category',
splitLine: {
show: true
},
data: a[0].x,
axisLabel: {
formatter: function(e) {
var year = e.split('-')[0]
return year
}
}
},
yAxis: {
type: 'log',
position: 'right',
name: 'BTC Price (USD)',
nameLocation: 'middle',
nameGap: 48,
splitLine: {
show: false
},
axisLabel: {
formatter: '${value}'
},
max: 100000
},
series: [{
name: a[0].name,
type: 'line',
data: a[0].y,
stack: 'a',
},
{
type: 'line',
data: a[1].y.map((o, i) => o - a[0].y[i]),
stack: 'a',
areaStyle: {
color: '#cccccc'
},
lineStyle: {
opacity: 0
}
},
{
type: 'line',
data: a[3].y,
stack: 'b',
lineStyle: {
opacity: 0
}
},
{
name: a[2].name,
type: 'line',
data: a[2].y.map((o, i) => o - a[3].y[i]),
stack: 'b',
areaStyle: {
color: '#cccccc'
}
},
{
name: a[4].name,
type: 'line',
data: a[4].y,
}
]
};
myChart.setOption(option);
});
</script>
</body>
</html>
分享


