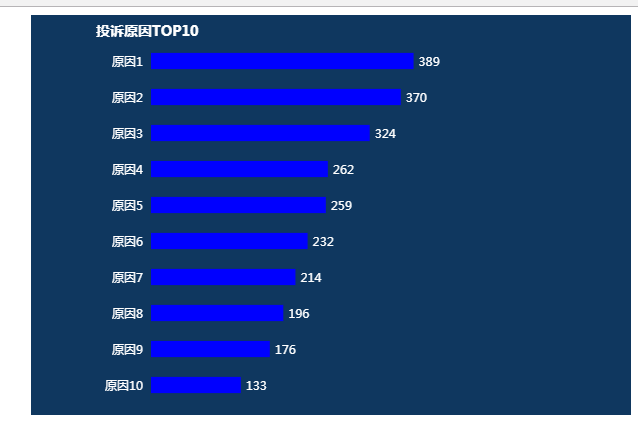
「已注销」 2018-08-07 06:21 采纳率: 46.7%
浏览 2881
已采纳

echarts 显示数据出现问题,json取出数据后无法显示

如图,想显示的数据如图:
图片说明

这数据是直接写死的,代码如下:

 <body>
    <div id="line" style="width:600px; height: 400px;float:right"></div>
</body>


<script type="text/javascript">
    $(function() {
        loaderBar();
    });

    function loaderBar() {

        var myChart = echarts.init(document.getElementById('line'));

        var dataAll = [ 389, 259, 262, 324, 232, 176, 196, 214, 133, 370 ];

        var yAxisData = [ '原因1', '原因2', '原因3', '原因4', '原因5', '原因6', '原因7',
                                '原因8', '原因9', '原因10' ];

        var option = {
            backgroundColor : '#0f375f',
            title : [ {
                text : "投诉原因TOP10",
                x : '10%',
                y : '1%',
                textStyle : {
                    color : "#fff",
                    fontSize : "14"
                }
            }, ],
            grid : [ {
                x : '20%',
                y : '7%',
                width : '45%',
                height : '90%'
            }, ],
            tooltip : {
                formatter : '{b} ({c})'
            },
            xAxis : [ {
                gridIndex : 0,
                axisTick : {
                    show : false
                },
                axisLabel : {
                    show : false
                },
                splitLine : {
                    show : false
                },
                axisLine : {
                    show : false
                }
            }, ],
            yAxis : [ {
                gridIndex : 0,
                interval : 0,
                data : yAxisData.reverse(),
                axisTick : {
                    show : false
                },
                axisLabel : {
                    show : true
                },
                splitLine : {
                    show : false
                },
                axisLine : {
                    show : false,
                    lineStyle : {
                        color : "white"
                    }
                },
            } ],
            series : [ {
                name : '投诉原因TOP10',
                type : 'bar',
                xAxisIndex : 0,
                yAxisIndex : 0,
                barWidth : '45%',
                itemStyle : {
                    normal : {
                        color : 'blue'
                    }
                },
                label : {
                    normal : {
                        show : true,
                        position : "right",
                        textStyle : {
                            color : "white"
                        }
                    }
                },
            data : dataAll.sort(),
            },

            ]
        };
        myChart.setOption(option); 

</script>

但是我把它动态用ajax调用的时候,就无法显示数据了,代码如下:

<body>
    <div id="line" style="width:600px; height: 400px;float:right"></div>
</body>


<script type="text/javascript">
    $(function() {
        loaderBar();
    });


    function loaderBar() {

        var myChart = echarts.init(document.getElementById('line'));

        var dataAll = [/* 389, 259, 262, 324, 232, 176, 196, 214, 133, 370 */];

        var yAxisData = [/*  '原因1', '原因2', '原因3', '原因4', '原因5', '原因6', '原因7',
                        '原因8', '原因9', '原因10'  */];

    var option = {
            backgroundColor : '#0f375f',
            title : [ {
                text : "投诉原因TOP10",
                x : '10%',
                y : '1%',
                textStyle : {
                    color : "#fff",
                    fontSize : "14"
                }
            }, ],
            grid : [ {
                x : '20%',
                y : '7%',
                width : '45%',
                height : '90%'
            }, ],
            tooltip : {
                formatter : '{b} ({c})'
            },
            xAxis : [ {
                gridIndex : 0,
                axisTick : {
                    show : false
                },
                axisLabel : {
                    show : false
                },
                splitLine : {
                    show : false
                },
                axisLine : {
                    show : false
                }
            }, ],
            yAxis : [ {
                gridIndex : 0,
                interval : 0,
                /* data : yAxisData.reverse(), */
                axisTick : {
                    show : false
                },
                axisLabel : {
                    show : true
                },
                splitLine : {
                    show : false
                },
                axisLine : {
                    show : false,
                    lineStyle : {
                        color : "white"
                    }
                },
            } ],
            series : [ {
                name : '投诉原因TOP10',
                type : 'bar',
                xAxisIndex : 0,
                yAxisIndex : 0,
                barWidth : '45%',
                itemStyle : {
                    normal : {
                        color : 'blue'
                    }
                },
                label : {
                    normal : {
                        show : true,
                        position : "right",
                        textStyle : {
                            color : "white"
                        }
                    }
                },
                /* data : dataAll.sort(), */
            },

            ]
        };
        /* myChart.setOption(option); */

        var dataAll = [389, 259, 262, 324, 232, 176, 196, 214, 133, 370];

        var yAxisData = ['原因1', '原因2', '原因3', '原因4', '原因5', '原因6', '原因7',
                        '原因8', '原因9', '原因10'];

        $.ajax({

            type : 'get',
            url : 'json/indexdata.json',//请求数据的地址
            dataType : "json", //返回数据形式为json
            success : function(result) {
                //请求成功时执行该函数内容,result即为服务器返回的json对象
                $.each(result.rankList, function(index, item) {
                    yAxisData.push(item.name); //挨个取出类别并填入类别数组                    
                    dataAll.push(item.count); //挨个取出销量并填入销量数组
                }); 
                myChart.hideLoading();  
                /* alert(yAxisData);
                alert(dataAll);
                return ;  */
                option.yAxis.data=yAxisData;
                option.series.data=dataAll;
                myChart.setOption(option);  

            }

        });


    }
</script>

数据是能够拿到,但是现在图表无法显示出来。
图片说明

哪位大佬帮忙看看,感谢呀,江湖救急!

  • 写回答

7条回答

  • 张音乐 博客专家认证 2018-08-07 07:33
    关注
     <script type="text/javascript">
        $(function() {
            loaderBar();
        });
    
    
        function loaderBar() {
            $.ajax({
                type : 'get',
                url : 'json/indexdata.json',//请求数据的地址
                dataType : "json", //返回数据形式为json
                success : function(result) {
                    //请求成功时执行该函数内容,result即为服务器返回的json对象
                    $.each(result.rankList, function(index, item) {
                        yAxisData.push(item.name); //挨个取出类别并填入类别数组                    
                        dataAll.push(item.count); //挨个取出销量并填入销量数组
                    }); 
                                    drawChart(dataAll,yAxisData);
                }
    
            });
    
        }
    
            var drawChart = function(data,yAxisData){
    
                    var myChart = echarts.init(document.getElementById('line'));
    
                    var option = {
                                    backgroundColor : '#0f375f',
                                    title : [ {
                    text : "投诉原因TOP10",
                    x : '10%',
                    y : '1%',
                    textStyle : {
                        color : "#fff",
                        fontSize : "14"
                    }
                }, ],
                grid : [ {
                    x : '20%',
                    y : '7%',
                    width : '45%',
                    height : '90%'
                }, ],
                tooltip : {
                    formatter : '{b} ({c})'
                },
                xAxis : [ {
                    gridIndex : 0,
                    axisTick : {
                        show : false
                    },
                    axisLabel : {
                        show : false
                    },
                    splitLine : {
                        show : false
                    },
                    axisLine : {
                        show : false
                    }
                }, ],
                yAxis : [ {
                    gridIndex : 0,
                    interval : 0,
    
                    axisTick : {
                        show : false
                    },
                    axisLabel : {
                        show : true
                    },
                    splitLine : {
                        show : false
                    },
                    axisLine : {
                        show : false,
                        lineStyle : {
                            color : "white"
                        }
                    },
                } ],
                series : [ {
                    name : '投诉原因TOP10',
                    type : 'bar',
                    xAxisIndex : 0,
                    yAxisIndex : 0,
                    barWidth : '45%',
                    itemStyle : {
                        normal : {
                            color : 'blue'
                        }
                    },
                    label : {
                        normal : {
                            show : true,
                            position : "right",
                            textStyle : {
                                color : "white"
                            }
                        }
                    },
                   data : data.sort(),
                },
    
                ]
            };
           myChart.setOption(option); 
            }
    </script>
    
    本回答被题主选为最佳回答 , 对您是否有帮助呢?
    评论
查看更多回答(6条)

报告相同问题?

悬赏问题

  • ¥15 孟德尔随机化r语言运行问题
  • ¥15 pyinstaller编译的时候出现No module named 'imp'
  • ¥15 怎么把多于硬盘空间放到根目录下
  • ¥15 Matlab问题解答有两个问题
  • ¥50 Oracle Kubernetes服务器集群主节点无法访问,工作节点可以访问
  • ¥15 LCD12864中文显示
  • ¥15 在使用CH341SER.EXE时不小心把所有驱动文件删除了怎么解决
  • ¥15 gsoap生成onvif框架
  • ¥15 有关sql server business intellige安装,包括SSDT、SSMS。
  • ¥15 stm32的can接口不能收发数据