
使用matplotlib画图并用savefig保存时速度过慢,领导要求要在一秒内保存完一张绘制好的pdf文件。
目前用的backend后端为‘pdf’,试过cairo后端,速度会快一点但是因为还要安装第三方插件所以不符合要求。
请问还有什么方法能够提升savefig和画图的速度吗
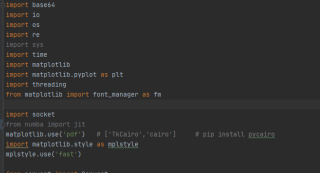
import base64
import io
import os
import re
import sys
import time
import matplotlib
import matplotlib.pyplot as plt
import threading
from matplotlib import font_manager as fm
import socket
from numba import jit
matplotlib.use('pdf') # ['TkCairo','cairo'] # pip install pycairo
import matplotlib.style as mplstyle
mplstyle.use('fast')
from convert import Convert
from figure.mat_base import Base
from figure.mat_line import Line
from figure.mat_polygon import Polygon
from figure.mat_text import Text
from figure.mat_circle import Circle
from figure.mat_arc import Arc
from graph_crop import GraphCrop
class MyCanvas(object):
pixel_to_figsize = 2.54 * 100
def __init__(self):
"""
添加字体文件,创建画布和坐标轴
"""
self.fig = None
self.ax = None
font_dirs = ['fonts/', ] # 需要设置绝对路径
font_files = fm.findSystemFonts(fontpaths=font_dirs)
font_list = fm.createFontList(font_files)
fm.fontManager.ttflist.extend(font_list) # 加字体
def _make_canvas_info(self, info):
"""
获得文件头的信息
:param info: caac文件翻译后的内容
:return:
"""
info_dict = info[0]
canvas_width = info_dict['canvas_width']
canvas_height = info_dict['canvas_height']
if info_dict['background_extent']:
background_extent = info_dict['background_extent']
meridian = info_dict['meridian']
south_latitude = info_dict['south_latitude']
first_parallel = info_dict['first_parallel']
second_parallel = info_dict['second_parallel']
chart_scale = info_dict['chart_scale']
return canvas_width, canvas_height
def _make_canvas(self, info):
"""
根据文件头的信息创建画布
:param info: caac文件翻译后的内容
:return:
"""
canvas_width, canvas_height = self._make_canvas_info(info)
plt.cla()
# 创建画布
self.fig, self.ax = plt.subplots(nrows=1,
ncols=1,
subplot_kw=dict(aspect='equal',
facecolor='white'
),
figsize=(canvas_width/self.pixel_to_figsize*Base.scale, canvas_height/self.pixel_to_figsize*Base.scale), # scale=0.4 (800,1000)
facecolor='sienna',
frameon=False
)
# 固定坐标轴, 防止显示图片时坐标变动
self.ax.set_xlim(0, canvas_width*Base.scale)
self.ax.set_ylim(0, canvas_height*Base.scale)
self.fig.dpi = 254 # 设置画布的精度
self.ax.xaxis.set_ticks_position('top') # 将X坐标轴移到上面
self.ax.invert_yaxis() # 反转Y坐标轴
plt.plot(clip_on=False)
self.ax.axis('off') # 隐藏坐标轴
def _draw(self, info):
"""
绘制图形
:param info:caac文件翻译后的内容
:return:
"""
print('开始画图')
begin = time.time()
for json_dict in info[1:]:
if json_dict['type'] == 'line':
line = Line(json_dict, self.ax, plt)
line.draw()
elif json_dict['type'] == 'text':
text = Text(json_dict, self.ax, plt)
text.draw()
elif json_dict['type'] == 'circle':
circle = Circle(json_dict, self.ax, plt)
circle.draw()
elif json_dict['type'] == 'polygon':
polygon = Polygon(json_dict, self.ax, plt)
polygon.draw()
elif json_dict['type'] == 'arc':
arc = Arc(json_dict, self.ax, plt)
arc.draw()
plt.subplots_adjust(top=1, bottom=0, right=1, left=0, hspace=0, wspace=0)
plt.margins(0, 0) # 调整画布留白
print('画图时间', time.time() - begin)
def _add_background(self, info):
"""
添加背景图
:param info: caac文件翻译后的内容
:return:
"""
background_file_name = 'GEO' + str(int(info[0]['chart_scale'] / 10000)) + '.jpg'
g = GraphCrop(info[0], '../ChartFile/' + background_file_name)
# g = GraphCrop(info[0], '../ChartFile/' + 'result.eps')
# img = plt.imread('dorua.jpg')
# img = cv2.resize(img, (200, 200))
# print(img.shape)
# cv2.imwrite('dorua2.jpg', img)
img = g.crop()
# ax.imshow(img, extent=[0, 1400, 2200, 0])
extent = info[0]['background_extent']
begin = time.time()
self.ax.imshow(img, extent=extent, resample=False, clip_on=True, interpolation='none')
print('加背景时间', time.time() - begin)
def _canvas_to_data(self, mode, file_name):
"""
将fig画布转换为图片二进制流或者pdf文件及其路径
:param mode: 应用模式
:return:
"""
if mode == 'webservice_byte':
"""二进制流"""
begin = time.time()
buffer = io.BytesIO() # 获取输入输出流对象
# self.fig.canvas.print_pdf(buffer) # 将画布上的内容打印到输入输出流对象
self.fig.canvas.print_png(buffer)
print('将画布上的内容打印到输入输出流对象:', time.time()-begin)
data = buffer.getvalue() # 获取流的值
buffer.close()
begin = time.time()
print('写入pdf的时间', time.time()-begin)
img_data = str(base64.b64encode(data)) # 转为base64格式
img_data = img_data[2:-1]
img_data = r'"data:image/png;base64,' + img_data + r'"'
print('service处理二进制流的时间', time.time()-begin)
# img_data = r'<img src="data:image/png;base64,' + img_data + r'">' # 拼为img标签
return img_data
elif mode == 'webservice_file':
result_path = '/result/' + file_name + '.pdf'
"""二进制流"""
begin = time.time()
buffer = io.BytesIO() # 获取输入输出流对象
# self.fig.canvas.print_pdf(buffer) # 将画布上的内容打印到输入输出流对象
self.fig.canvas.print_svg(buffer)
print('将画布上的内容打印到输入输出流对象:', time.time() - begin)
data = buffer.getvalue() # 获取流的值
buffer.close()
begin = time.time()
# 获取计算机名称
hostname = socket.gethostname()
# 获取本机IP
ip = socket.gethostbyname(hostname)
with open('..' + result_path, 'wb') as f:
f.write(data)
print('写入pdf的时间', time.time() - begin)
return 'http://' + ip + ':8000' + result_path
elif mode == 'c#':
begin = time.time()
buffer = io.BytesIO() # 获取输入输出流对象
self.fig.canvas.print_svg(buffer) # 将画布上的内容打印到输入输出流对象
# self.fig.canvas.print_png(buffer)
data = buffer.getvalue() # 获取流的值
buffer.close()
print('将画布上的内容打印到输入输出流对象:', time.time() - begin)
with open('result.svg', 'wb') as f:
f.write(data)
return ''
elif mode == 'c#pdf':
begin = time.time()
plt.savefig("result.pdf", pad_inches=0)
print('生成pdf时间', time.time()-begin)
data = os.getcwd()
# with open('result1.pdf', 'rb') as f:
# data = f.read()
# os.remove('result1.pdf')
# data = str(base64.b64encode(data))[2:-1]
# with open('result.pdf', 'wb') as f:
# f.write(data)
# buffer.write(data) # 将数据写入buffer
# img = Image.open(buffer) # 使用Image打开图片数据
# img = np.asarray(img)
# print("转换的图片array的尺寸为:\n", img.shape)
# print("转换的图片array为:\n", img)
# return str(data)[2:-1]
return data + r'\result.pdf'
def _get_file_name(self, file_path):
"""
从文件路径中提取出文件名
:param file_path:
:return:
"""
file_name = re.search('ChartFile/.*', file_path).group()
file_name = file_name.replace('ChartFile/', '').replace('.caac', '')
return file_name
def run(self, file_path, mode):
"""
:param file_path: caac文件路径
:param mode: 应用模式 ['webservice_byte', 'webservice_file', 'c#', 'c#pdf']
:return:
"""
file_name = self._get_file_name(file_path)
start = time.time()
begin = time.time()
# info = get_json('../进近图PDF/ZBAA-9A-13.json')
# info = get_json('../进近图PDF/JsonTransfer.json')
with open(file_path, 'rb') as f:
c = Convert(f)
info = c.convert_to_json()
self._make_canvas(info)
print('读取结构体文件时间:', time.time()-begin)
t1 = threading.Thread(target=self._draw, args=(info,))
t1.start()
# 添加背景
# if info[0]['background_extent']:
# print('开始添加背景')
# t2 = threading.Thread(target=self._add_background, args=(info,))
# t2.start()
# t2.join()
t1.join()
data = self._canvas_to_data(mode, file_name)
over = time.time()
print('总时间', over - start)
if 'webservice' in mode:
print(over - start)
return data
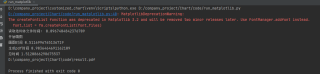
if __name__ == '__main__':
canvas = MyCanvas()
# for i in range(3):
# print(canvas.run("../进近图PDF/ZBAA-9A(2).caac", 'c#pdf'))
print(canvas.run("../ChartFile/ZUJZ-9A.caac", 'c#pdf'))
# print(canvas.run("../ChartFile/ZUJZ75.caac", 'c#'))
# args = sys.argv
# print(canvas.run(args[1], 'c#pdf'))


