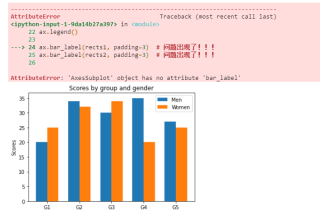
引用https://matplotlib.org/stable/gallery/lines_bars_and_markers/barchart.html#sphx-glr-gallery-lines-bars-and-markers-barchart-py中的代码,提示没有bar_label方法!
以下是源代码:
import matplotlib
import matplotlib.pyplot as plt
import numpy as np
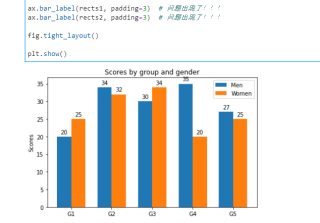
labels = ['G1', 'G2', 'G3', 'G4', 'G5']
men_means = [20, 34, 30, 35, 27]
women_means = [25, 32, 34, 20, 25]
x = np.arange(len(labels)) # the label locations
width = 0.35 # the width of the bars
fig, ax = plt.subplots()
rects1 = ax.bar(x - width/2, men_means, width, label='Men')
rects2 = ax.bar(x + width/2, women_means, width, label='Women')
# Add some text for labels, title and custom x-axis tick labels, etc.
ax.set_ylabel('Scores')
ax.set_title('Scores by group and gender')
ax.set_xticks(x)
ax.set_xticklabels(labels)
ax.legend()
ax.bar_label(rects1, padding=3) # 问题出现了!!!
ax.bar_label(rects2, padding=3) # 问题出现了!!!
fig.tight_layout()
plt.show()
更新了matplotlib包,也无济于事,快帮我看看是哪里出了问题???