import matplotlib.pyplot as plt
import numpy as np
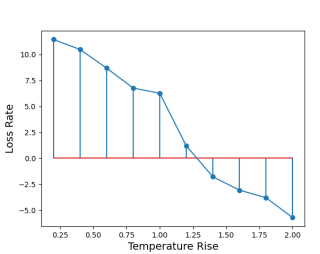
x_values=[0.2, 0.4, 0.6, 0.8, 1.0, 1.2, 1.4, 1.6, 1.8, 2.0]
y_values=[11.463, 10.499, 8.705, 6.775, 6.278, 1.198, -1.79, -3.073, -3.809, -5.727]
plt.xlabel("Temperature Rise",fontsize=14)
plt.ylabel("Loss Rate", fontsize=14)
plt.stem(x_values, y_values)
plt.plot(x_values, y_values)
plt.show()