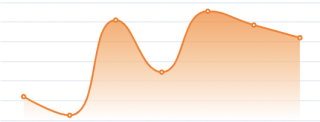
想要这个效果
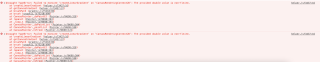
代码如下:
transaction() {
      let transaction = document.getElementById('transaction')
      let myChart = echarts.init(transaction)// 基于准备好的dom,初始化echarts实例
      let option
      let xzhou = []
      let yzhou = []
      option = {
        textStyle: {
          color: 'rgb(85,169,254)'
        },
        tooltip: { //提示框
          trigger: 'axis',
          formatter: '时间:{b}</br>{a}:{c}'
        },
        legend: {
          left: '70%',
          top: '8%',
          // 左偏移70%,上偏移8%
          data: ['存证数量']
        },
        xAxis: {
          type: 'category',
          axisLabel: {
            interval: 0,
            rotate: 20
          },
          axisLine: {
            show: false
          },
          //不显示刻度尺
          axisTick: {
            show: false
          },
          data: xzhou


        },
        yAxis: {
          name: '单位/个',
          type: 'value',
          //不显示y轴数据
          axisLine: {
            show: false
          },
          axisTick: {
            show: false
          }
        },

        // 将容器向左偏移50
        grid: {
          left: 50
        },
        series: [{
          itemStyle: {
            borderRadius: 3, //图形圆角
            color: 'rgb(254,122,14)',
          },
          name: '存证数量',
          type: 'line',
          smooth: true,
          areaStyle: {
            //设置渐变色
            color: new echarts.graphic.LinearGradient(
              0, 0, 0, 1,
              [
                { offset: 0, color: 'rgb(254,122,14)' },
                { offset: 1, color: 'rgb(255,255,255)' }
              ]
            )
          },
          barWidth: '40%',
          data: ['yzhou']
        }]
      }
      myChart.setOption(option)
      window.onresize = function() {//用于使chart自适应高度和宽度
        myChart.resize()
      }
使用渐变色会报下面错误