
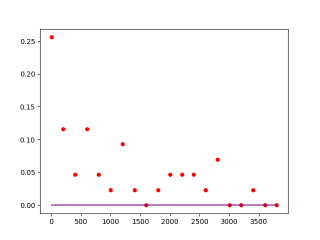
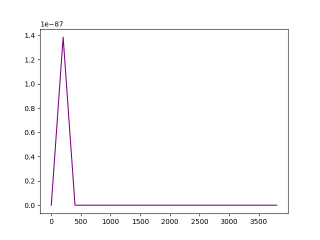
请问为什么画了散点图之后的威布尔分布变成了一条直线,如果没画散点图就是一切正常

请问为什么画了散点图之后的威布尔分布变成了一条直线,如果没画散点图就是一切正常
 分享
分享
看下你的方式对不对,你试试这个呢
import numpy as np
import matplotlib.pyplot as plt
c = #尺度系数
k = # 形状系数

def weib(x):
    """
威布尔分布函数
    @param x:
    @return:
    """
    return (k / c) * (x / c) ** (k - 1) * np.exp(-(x / c) ** k)

def weibull_fig():
    """
做威布尔概率密度函数
    """
    x = np.arange(1, 2500.) / 100.
    plt.plot(x, weib(x))
    plt.show()

if __name__ == '__main__':
    weibull_fig()
分享 已采纳回答
7月21日
已采纳回答
7月21日

