

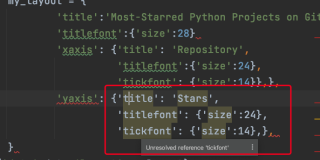
pycharm高亮了这里
import requests
from plotly.graph_objs import Bar
from plotly import offline
url='https://api.github.com/search/repositories?q=language:python&sort=stars'
headers = {'Accept': 'application/vnd.github.v3+json'}
r = requests.get(url,headers = headers)
print(f"Status code:{r.status_code}")

response_dict = r.json()
repo_dicts = response_dict['items']
repo_names,stars = [],[]

for repo_dict in repo_dicts:
        repo_names.append(repo_dict['name'])
        stars.append(repo_dict['stargazers_count'])
        data = [{
                'type':'bar',
                'x':repo_names,
                'y':stars,
                'marker': {'color': 'rgb(60,100,150)',
                           'line': {'width': 1.5, 'color': 'rgb(25,25,25)'}},
                'opacity': 0.6
        }]
        my_layout = {
                'title':'Most-Starred Python Projects on Github',
                'titlefont':{'size':28}
                'xaxis': {'title': 'Repository',
                          'titlefont':{'size':24},
                          'tickfont': {'size':14}},},
                'yaxis': {'title': 'Stars',
                          'titlefont': {'size':24},
                          'tickfont': {'size':14},},
        }
fig = {'data':data,'layout':my_layout}
offline.plot(fig, filename='python.repos.html')
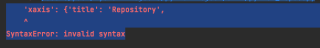
我是什么没输对吗?


