
我刚学python没多久,我们老师基本上什么也不教,就让我们自学,这是我们其中一次作业,我不知道怎么写
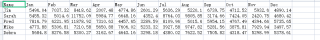
这个是csv文件数据
    # ------------------------------- Imported Packages -------------------------------
    import csv
    import matplotlib.pyplot as plt

    # ----------------------------- Function Definitions ------------------------------

    def menu():
# Display menu
print("Used Car Sales")
print("\n1. Import sales data from csv") # import sales data
print("2. Calculate total sales for each employee") # calculate total sales of employees
print("3. Calculate mean sales for each employee") # calculate the monthly mean sales for each employee
print("4. Graph of monthly sales data") # Create graph of monthly sales data
print("5. Exit") # Exit program

option = -1 # used to store the user's choice

# while x is less than 1 or greater than 5, loop
# used to validate user input
while option < 1 or option > 5:
    # get user's choice
    option = int(input("\nwhich operation do you want to perform?\n"))

return option

    # ---------------------------------------------------------------------------------

    # function which will open the csv file and read in its values and return a list containing each record as a dictionary
    def open_csv_file(file_path):

database = [] # create empty list

with open(file_path,"r") as csv_file: # open file in read mode
    # use DictReader to read in the data
    csv_reader = csv.DictReader(csv_file, delimiter=",")

    # add each line, as a dictionary, to the list 'database'
    for line in csv_reader:
        database.append(dict(line))
    print(database)
    # return the database
    return database

    # ---------------------------------------------------------------------------------

    # finds and returns a list of the total sales for each employee
    def calc_total_sales(database):
# create empty list
total_sales = []
# iterate through each record
for num in total_sales:
    num = 0
    print(num)
    # initialise a variable to track the total

    # loop through each key (need to ignore name key) and add to total
    # append total value to total_sales list


# return list of total sales for each employee
return total_sales

    # ---------------------------------------------------------------------------------

    def calc_mean_sales(sales_list):
pass # DELETE THIS AND ADD YOUR CODE HERE

    # ---------------------------------------------------------------------------------

    def show_graph(database):

x_values = ["Jan","Feb","Mar","Apr","May","Jun","Jul","Aug","Sep","Oct","Nov","Dec"] # COMPLETE THIS LIST
y_values = [] # used to store y values

# ADD SOME CODE TO LOOP THROUGH ALL EMPLOYEES - CURRENTLY THIS ONLY WORKS FOR FIRST EMPLOYEE

# get sales data and store in y_values list
for key in x_values:
     y_values.append(float(database[0][key])) # will need to modify this for all employees

# add data line to the graph
plt.plot(x_values,y_values,'b',label=database[0]["Name"]) # will need to modify this for all employees

# set graph attributes
plt.xlabel("X AXIS")
plt.ylabel("Y AXIS")
plt.title('SUITABLE TITLE')
plt.legend()
plt.show()
plt.ion()

# pause the program to show graph
input("enter to return to menu...")
plt.close('all')

    # -------------------------- Initialise Global Variables --------------------------

    sales_data = [] # list to store the sales data as a dictionary
    total_sales = [] # list to store the total sales for employees
    mean_sales = [] # list to store the mean sales for employees

    read_file_path = "sales_data.csv" # file path for file to be read

    # ---------------------------------- Main Program ---------------------------------

    end_program = False # variable used to check if user wants to exit program

    # loop until end_program is True
    while not end_program:

# call menu function and get user's choice
option = menu()

if option == 1: # import data from csv
    sales_data = open_csv_file(read_file_path)

    # used for debug only, DELETE once program complete
    for record in sales_data:
        print(record)

elif option == 2: # Calculate total sales for each employee
    total_sales = calc_total_sales(sales_data)

    # Show total sales
    print(total_sales)

elif option == 3: # Calculate mean sales for each employee
    mean_sales = calc_mean_sales(total_sales)

elif option == 4: # Create graph of monthly sales
    show_graph(sales_data)

else: # option 5 - exit in controlled manner

    # set end_program Boolean to True
    end_program = True

    # output messages to user
    print("Thank you for using this program")
    print("Quitting Program...")


