想知道怎么组合成一个关系图

d3.js的力导向图,想知道怎么组合成一个关系图

- 写回答
- 好问题 0 提建议
- 关注问题
 分享
分享- 邀请回答
-

1条回答 默认 最新
 你知我知皆知 2024-08-07 19:02关注
以下回答参考 皆我百晓生、券券喵儿 等免费微信小程序相关内容作答,并由本人整理回复。
要将D3.js的力导向图与CSS结合起来创建一个关系图,请按照以下步骤操作:
首先,在HTML中添加一些基本元素:
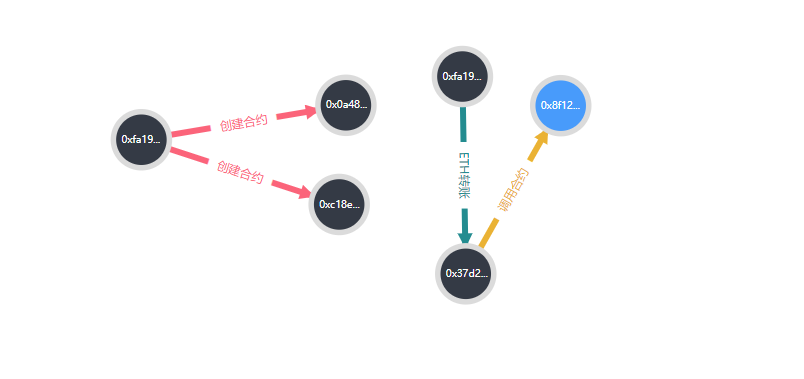
<!DOCTYPE html>
<html lang="en">
<head>
    <meta charset="UTF-8">
    <meta name="viewport" content="width=device-width, initial-scale=1.0">
    <title>Relationship Graph with D3.js and CSS</title>
    <style>
        body {
            font-family: Arial, sans-serif;
        }
        .node {
            cursor: pointer;
            display: inline-block;
            width: 60px;
            height: 60px;
            margin-right: 5px;
            background-color: #ccc;
            color: white;
            text-align: center;
            line-height: 60px;
        }
        .edge {
            stroke-dasharray: 5; /* 短线段 */
            stroke-dashoffset: 5; /* 初始短线段长度 */
            stroke-linecap: round;
            stroke-miterlimit: 10;
            stroke-width: 2;
            stroke: #666;
        }
        .edge:hover {
            stroke-width: 4;
        }
    </style>
</head>
<body>
<!-- 示例数据 -->
<div id="graph"></div>
<script src="https://d3js.org/d3.v6.min.js"></script>
<script>
    // 示例数据
    const data = [
        {source: 'OxfA19', target: '0x0a48', type: 'create_contract'},
        {source: 'OxfA19', target: '0x8f12', type: 'transfer_eth'},
        {source: 'OxfA19', target: 'OxfA19', type: 'call_contract'}
    ];

    function drawGraph(data) {
        // 创建节点和边
        let nodes = d3.select("#graph")
            .selectAll("circle")
            .data(data)
            .enter()
            .append("circle")
            .attr("cx", d => d.source)
            .attr("cy", d => d.target)
            .attr("r", 10);

        // 添加节点样式
        nodes.append("title").text(d => `${d.source} -> ${d.target}`);

        // 创建边
        let edges = d3.select("#graph")
            .selectAll("line")
            .data(data)
            .enter()
            .append("line")
            .attr("class", "edge");

        // 设置边样式
        edges.append("title").text(d => `(${d.source}, ${d.target})`);
    }

    drawGraph(data);
</script>
</body>
</html>
这个示例展示了如何使用D3.js绘制一个简单的力导向图,并将其与CSS结合在一起。你可以根据实际需求调整样式和布局。
请注意,这个例子中的数据是虚构的例子,你需要替换为你的实际数据。
解决 无用评论 打赏举报 分享
- 2025-03-29 00:05大模型大数据攻城狮的博客 是 D3.js 中用于解析 CSV 数据的函数。当遇到非标准格式的数据时,可以通过自定义解析逻辑来处理。在 D3.js 里,能够借助tickFormat方法来自定义坐标轴的刻度格式,像添加货币符号、百分比符号这类。若要为刻度添加...
- 2025-09-12 11:039q8w7e6r5的博客 本文详细介绍了如何利用D3.js将静态的技能树数据转化为动态、可交互的前端学习路径图。通过五个核心步骤,包括构建力导向图、实现节点拖拽、添加展开/折叠与工具提示交互,并探讨了性能优化与部署方案,帮助开发者...
- 2025-07-01 15:24木牛流马2077的博客 D3.js,全称为“Data-Driven Documents”(数据驱动的文档),是一个用于根据数据来操作文档的 JavaScript 库 1。对于初学者而言,最重要的一点是:D3 不是一个传统意义上的图表库。与 Chart.js 或 ECharts 这类高级...
- 2025-07-22 06:25beer8的博客 本文是一篇前端知识图谱可视化实战教程,详细介绍了如何使用NeoVis.js快速连接并可视化Neo4j图数据库。内容涵盖从环境搭建、核心配置到完整Vue组件开发的完整流程,并提供了性能优化与生产部署建议,帮助前端开发者...
- 2018-07-12 20:15weixin_30299709的博客 数据可视化是数据科学和前端开发领域的关键技术,它通过图形化...本文聚焦于利用D3.js这一强大的底层可视化库,结合结构化的YAML数据,构建一个动态、交互式的个人技能图谱系统。通过设计精细的技能数据模型(涵盖熟练
- 2016-10-24 11:13冰峰zoubf的博客 这个的细节我也不大明白,主要思路就是在一般的力导向图上修改连线的path (1)创建三种连线的标记 //各自属性是什么意思?? svg.append("svg:defs").selectAll("marker") .data(["suit", "licensing", ...
- 2026-02-15 00:25hey one的博客 本文详细介绍了如何利用Three.js将传统2D网络拓扑图升级为沉浸式3D可视化方案。通过实战演示了模型贴图、PBR材质、光线追踪及后期处理等核心技术,解决了2D视图在表达复杂网络层级与空间关系时的局限,并深入探讨了...
- 2023-06-25 11:10爱划水de鲸鱼哥~的博客 3d-force-graph是一种基于力导向图的可视化工具,它可以帮助我们更直观地展示数据之间的关系。在使用3d-force-graph时,我们经常会遇到一种情况,即具有相同属性的子节点需要在一起展示,这时我们可以通过一些方法来...
- 2026-02-28 00:31Rubix-Kai的博客 本文介绍了如何在星图GPU平台上自动化部署CasRel关系...通过该平台,开发者可快速搭建基于Node.js的REST API服务,实现对文本中实体关系的自动化抽取,典型应用场景包括从新闻或评论中提取结构化信息以生成知识图谱。
- 2026-05-09 01:09老爸评测的博客 其核心原理是通过解析源代码的抽象语法树(AST),构建程序元素的内部表示模型,进而分析其结构、依赖关系和代码质量。这项技术的核心价值在于将难以直观理解的文本代码转化为结构化的数据模型,为架构治理、技术...
- 没有解决我的问题, 去提问
