function renderItem(params, api) {
//自定义系列
var categoryIndex = api.value(0); //这里使用 api.value(0) 取出当前 dataItem 中第一个维度的数值。
var start = api.coord([api.value(1), categoryIndex]); // 这里使用 api.coord(...) 将数值在当前坐标系中转换成为屏幕上的点的像素值
var end = api.coord([api.value(2), categoryIndex]); // 这里使用 api.coord(...) 将数值在当前坐标系中转换成为屏幕上的点的像素值
var height = api.size([0, 1])[1] * 0.4; // 这里使用 api.size(...) 获得 Y 轴上数值范围为 1 的一段所对应的像素长度。控制柱形大小
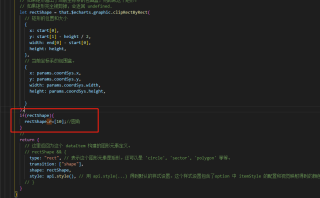
// shape 属性描述了这个矩形的像素位置和大小。
// 其中特殊得用到了 echarts.graphic.clipRectByRect,意思是,
// 如果矩形超出了当前坐标系的包围盒,则剪裁这个矩形。
// 如果矩形完全被剪掉,会返回 undefined.
var rectShape = echarts.graphic.clipRectByRect(
// 矩形的位置和大小
{
x: start[0],
y: start[1] - height / 2,
width: end[0] - start[0],
height: height,
},
// 当前坐标系的包围盒。
{
x: params.coordSys.x,
y: params.coordSys.y,
width: params.coordSys.width,
height: params.coordSys.height,
}
);
return (
// 这里返回为这个 dataItem 构建的图形元素定义。
rectShape && {
type: "rect", // 表示这个图形元素是矩形。还可以是 'circle', 'sector', 'polygon' 等等。
transition: ["shape"],
shape: rectShape,
style: api.style(), // 用 api.style(...) 得到默认的样式设置。这个样式设置包含了option 中 itemStyle 的配置和视觉映射得到的颜色。
}
);
};
series: [
{
type: "custom",
renderItem: renderItem,
legendHoverLink:true,//联动时高亮
encode: {
x: [1, 2], // data 中『维度1』和『维度2』对应到 X 轴
y: 0, // data 中『维度0』对应到 Y 轴
},
itemStyle:{
borderType:'solid',
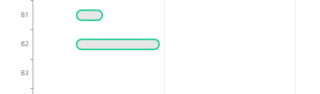
borderCap:"round",//线段末端为圆形
borderColor:"#28d094",
borderWidth:2,
}
data: data,
},
],
设置了borderCap:"round",但是不生效