weixin_39767322的博客Warning: I'm very new to using python.I'm trying to graph data using error bars but my data has different values for the error above and below the bar, i.e. 2+.75,2-.32.import numpy as npimport matplo...
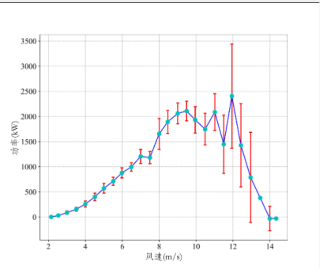
一条鱼谢谢的博客 errorbar(Time,Average1,Variance1,'r-o') %A地误差棒图,用红色线表示 hold on errorbar(Time,Average2,Variance2,'b-s') %B地误差棒图,用蓝色线表示 xlabel('Time');ylabel('Production'); subplot(2,2,4); ...

 分享
分享
 关注
关注 创建了问题
9月10日
创建了问题
9月10日