
急求一维抛物型方程的差分方法,要有数值解,精确解和误差分析,急求!


1条回答 默认 最新
 技术专家团-Joel 2021-09-22 18:54关注
你好!比如一维热传导方程就是抛物线型的
% Number of Control Volumes
N = 5;
% Domain length
L = 0.02; %[m]
% Grid Spacing
h = L/(N);
% Diffusivity (Thermal conductivity)
k = 0.5;  %[W/m-K]
% Uniform Heat Generation, A Source Term
q = 1000e3;     %  [W/m^(3)]
% The center of the first cell is at dx/2 & the last cell is at L-dx/2.
x = h/2 : h : L-(h/2);
% Cross sectional area of the 1D domain
A = 1;          %[m^2]
% Left Boundary Condition
T_a = 100;    %[\circ c]
% Right Boundary Condition
T_b = 200;    %[\circ c]
% Initialising Temperature
Nh = 2*N + 1; % the  number of node with temperature
T=zeros(Nh,1);
% Left Boundary Condition
T(1)= T_a;    %[\circ c]
% Right Boundary Condition
T(Nh) = T_b;    %[\circ c]
% Interior of Domain
index_x = 2:Nh-1;
%% Formation of Coefficient Matrices, Numerical Solution
% Tolerence
eps = 1.e-6;
% Iteration
It = 0;
T_old = T;
Error = 2*eps;
% Calculation
while   (Error > eps)
    It = It +1;
    T(index_x)= 0.5*(T(index_x-1) + T(index_x+1)+ (q*h*h/4)/(k)); % here divided by 4, cause h/2*h/2
    Error = max(abs(T(:)-T_old(:)));
    if any(isnan(T(:))) || any(isinf(T(:)))
        fprintf(' Iteration Diverge \n');
        return;
    end
    T_old = T;
end
T_Numeric = T(2:2:end);
%% Analytical Results
X_G = x;
T_Analytical=((T_b-T_a)/L + (q/(2*k))*( L - X_G )).*(X_G) + T_a;%解析解
%% Error Analysis
M_Error(N)=0;
for i=1:N
    % This x is only use to compare results on Versteeg book
    k=find(abs(X_G - x(i))<=1e-3);
    % No need to find k (You can but no Need)
    % Absolute Error
    M_Error(i) = abs(T_Numeric(i)-T_Analytical(i));
    % Relative Error
    Relative_Error(i) = abs(T_Numeric(i)-T_Analytical(i))/abs(T_Numeric(i));
    % Percentage Error
    Percentage_Error(i) = Relative_Error(i).*100;
end
%% Post Processing
% Data Table Comparison of Different Results
Nodes = 1 : N;
fprintf('Node\tGrid_{Loc.}\t\tT_{Num.}\t\tT_{An.}\t\tError\n\n');
fprintf('===\t\t=======\t\t=========\t\t=========\t\t=======\n');
for i = 1: N;
    fprintf('%3.0f\t\t%3.5f\t\t%3.5f\t\t%3.5f\t\t%3.5f\n',[Nodes(i); X_G(i); T_Numeric(i); T_Analytical(i); Percentage_Error(i)]);
end
% Graphical Representation
plot(100*x,T_Numeric,'-o','MarkerSize',5,'MarkerFaceColor','b');
% hold on
% plot([0, 100.*L], [T_a, T_b], 'd', 'LineWidth',3,'MarkerFaceColor','b');
hold on
plot(100*X_G,T_Analytical,'r--','LineWidth',2);
% hold on
% plot([0, 100.*L], [T_a, T_b], 'd', 'LineWidth',3,'MarkerFaceColor','r');
% xlim([0  2]);
% ylim([50 300]);
%Boundary Points Inclusion
xlabel('Distance (m)');
ylabel('Temperature [\circ C]');
legend('T_{Numeric}','T_{Analytical}');
title ('Numerical & Analytical Results Comparison');
grid on;
%通过不断迭代误差控制在1e-6内
% Number of Control Volumes
N = 5;
% Domain length
L = 0.02; %[m]
% Grid Spacing
h = L/(N);
% Diffusivity (Thermal conductivity)
k = 0.5;  %[W/m-K]
% Uniform Heat Generation, A Source Term
q = 1000e3;     %  [W/m^(3)]
% The center of the first cell is at dx/2 & the last cell is at L-dx/2.
x = h/2 : h : L-(h/2);
% Cross sectional area of the 1D domain
A = 1;          %[m^2]
% Left Boundary Condition
T_a = 100;    %[\circ c]
% Right Boundary Condition
T_b = 200;    %[\circ c]
% Initialising Temperature
Nh = 2*N + 1; % the  number of node with temperature
T=zeros(Nh,1);
% Left Boundary Condition
T(1)= T_a;    %[\circ c]
% Right Boundary Condition
T(Nh) = T_b;    %[\circ c]
% Interior of Domain
index_x = 2:Nh-1;
%% Formation of Coefficient Matrices, Numerical Solution
% Tolerence
eps = 1.e-6;
% Iteration
It = 0;
T_old = T;
Error = 2*eps;
% Calculation
while   (Error > eps)
    It = It +1;
    T(index_x)= 0.5*(T(index_x-1) + T(index_x+1)+ (q*h*h/4)/(k)); % here divided by 4, cause h/2*h/2
    Error = max(abs(T(:)-T_old(:)));
    if any(isnan(T(:))) || any(isinf(T(:)))
        fprintf(' Iteration Diverge \n');
        return;
    end
    T_old = T;
end
T_Numeric = T(2:2:end);
%% Analytical Results
X_G = x;
T_Analytical=((T_b-T_a)/L + (q/(2*k))*( L - X_G )).*(X_G) + T_a;%解析解
%% 误差分析
M_Error(N)=0;
for i=1:N
    % This x is only use to compare results on Versteeg book
    k=find(abs(X_G - x(i))<=1e-3);
    % No need to find k (You can but no Need)
    % Absolute Error
    M_Error(i) = abs(T_Numeric(i)-T_Analytical(i));
    % Relative Error
    Relative_Error(i) = abs(T_Numeric(i)-T_Analytical(i))/abs(T_Numeric(i));
    % Percentage Error
    Percentage_Error(i) = Relative_Error(i).*100;
end
%% Post Processing
% Data Table Comparison of Different Results
Nodes = 1 : N;
fprintf('Node\tGrid_{Loc.}\t\tT_{Num.}\t\tT_{An.}\t\tError\n\n');
fprintf('===\t\t=======\t\t=========\t\t=========\t\t=======\n');
for i = 1: N;
    fprintf('%3.0f\t\t%3.5f\t\t%3.5f\t\t%3.5f\t\t%3.5f\n',[Nodes(i); X_G(i); T_Numeric(i); T_Analytical(i); Percentage_Error(i)]);
end
% Graphical Representation
plot(100*x,T_Numeric,'-o','MarkerSize',5,'MarkerFaceColor','b');
% hold on
% plot([0, 100.*L], [T_a, T_b], 'd', 'LineWidth',3,'MarkerFaceColor','b');
hold on
plot(100*X_G,T_Analytical,'r--','LineWidth',2);
% hold on
% plot([0, 100.*L], [T_a, T_b], 'd', 'LineWidth',3,'MarkerFaceColor','r');
% xlim([0  2]);
% ylim([50 300]);
%Boundary Points Inclusion
xlabel('Distance (m)');
ylabel('Temperature [\circ C]');
legend('T_{Numeric}','T_{Analytical}');
title ('Numerical & Analytical Results Comparison');
grid on;
误差分析
Node Grid_{Loc.} T_{Num.} T_{An.} Error === ======= ========= ========= ======= 1 0.00200 146.00000 146.00000 0.00000 2 0.00600 213.99999 214.00000 0.00000 3 0.01000 249.99999 250.00000 0.00000 4 0.01400 253.99999 254.00000 0.00000 5 0.01800 226.00000 226.00000 0.00000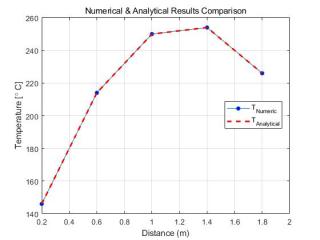 本回答被题主选为最佳回答 , 对您是否有帮助呢?解决 无用评论 打赏举报
 分享
分享
- 2022-07-15 13:16各种差分格式的求解一维差分方程实例,附有详细编程程序
- 2020-10-22 18:59胸中有数-数分版的博客 显(向前欧拉)格式、隐(向后欧拉)格式、C_N格式下的一维抛物型方程的求解与误差收敛分析
- 内容概要:本文详细介绍了求解一维抛物型方程的高精度有限差分方法。该方法基于六次样条函数进行空间离散,并采用(3,3)Padé时间近似,实现了六阶精度的有限差分格式。文章通过理论分析和数值实验验证了该格式的无...
- 2022-01-26 14:31在数值分析中,有限差分法是一种常用的求解这类方程的方法。本文将重点讨论在解决带导数的初边值问题时,如何使用有限差分法,特别是前向欧拉法和Crank-Nicolson格式,以及边界条件的处理。 首先,考虑抛物型PDE的...
- 2022-04-07 15:43文档中的"第二次作业.docx"很可能包含了对抛物方程差分格式的详细描述,包括问题的背景、数学模型、加权隐式方法的理论基础,以及对求解过程的分析。其中的结果图可能展示了数值解与解析解的比较,用于验证算法的...
- 2025-08-24 12:30内容概要:该论文提出了一种求解一维抛物型方程的高精度有限差分方法,基于六次样条函数的空间离散和(3,3)Padé时间近似,实现了六阶精度的数值解法。文中详细介绍了求解器的类结构设计、关键公式的实现、边界条件的...
- 2024-07-19 17:42紧差分格式求解一维抛物型方程初边值问题(matlab)
- 2021-04-30 04:06CHENG XIE的博客 交替方向的隐式差分格式( ADI 格式) 本章,我们研究线性抛物型方程的差分解法, 主要讨论差分方程的构造方法和有关的理论问题 以及研究方法等,重点在于一维线性抛物型方程 的差分方法,对于非线性以及多维抛物型方程的 ...
- 2025-08-08 19:28求解一维抛物热传导方程的各种数值方法及其MATLAB实现。首先阐述了一维抛物热传导方程的基本概念及其重要性,接着重点讲解了几种常用的数值方法,包括向前向后欧拉法、C-N格式和二阶BDF格式。每种方法的特点、适用...
- 2021-04-20 05:17weixin_35971787的博客 数学与计算科学学院 实 验 报 告 实验项目名称实验项目名称抛物型微分方程数值解 所属课程名称所属课程...成绩成绩 第 1 页 共 17 页 一 实验概述 一 实验概述 实验目的 实验目的 掌握抛物型方程的有限差分法 并学...
- 2022-04-18 20:50本篇将详细讲解如何利用MATLAB这一强大的科学计算工具,实现P-R差分格式以求解抛物型方程。 一、P-R差分格式基础 Peaceman-Rachford差分格式源于油藏模拟,用于处理双曲型和抛物型方程的混合问题。它通过交替隐式...
- 2021-04-22 15:05手机队长的博客 显式前向欧拉法源程序:function [u,x,t] = EF_Euler(A,xf,T,it0,bx0,bxf,M,N)%解方程 A u_xx = u_t , 0 <= x <= xf, 0 <= t <= T%初值: u(x,0) = it0(x)% 边界条件: u(0,t) = bx0(t), u(xf,t) = bxf(t...
- 2025-04-11 21:55内容概要:本文详细介绍了求解一维抛物热传导方程的各种经典数值方法,包括显式欧拉法、隐式欧拉法、Crank-Nicolson格式(即梯形公式)、二阶BDF格式以及不同的差分格式(如五点差分、九点差分和紧差分)。每种方法...
- 2019-08-21 17:04总的来说,这个MATLAB程序包提供了一个实用的工具,用于学习和研究如何利用交替隐方向P-R差分格式解抛物型方程。通过修改源项函数和精确解,用户可以灵活地适应各种抛物型问题,进行数值模拟和分析。在实际应用中,...
- 2022-07-01 23:12ADI方法是一种数值方法,用于求解二维或更高维的抛物型方程。它通过将时间方向和空间方向交替离散化,避免了直接求解大型稀疏线性系统的需要,从而提高了计算效率。在Matlab中,ADI算法通常包括一系列的迭代步骤,每...
- 2019-06-05 10:43一阶抛物方程的有限差分法的matlab代码,可对一阶抛物方程进行数值求解。
- 2021-04-22 15:05好诗如风的博客 用控制体积法构造差分 方程总是守恒型差分方程。 (4) 积分方法采用积分方法构造差分方程基本思想是把微分......第7卷第4期2008年12月 安徽职业技术学院学报J0uWAL0FANHUIVOCATIONAL V01.7No.4COLLEGEDec.2008 ...
- 2021-05-24 09:35带你玩遍北海道的博客 抛物型方程有限差分方法的应用 - 报告2015 年 秋 季学期研究生课程考核(读书报告、...类 别: 考核结果阅卷人抛物型方程有限差分方法的应用摘要抛物型偏微分方程是一类比较重要的偏微分方程。热传导方程是最简单的...
- 2021-05-31 08:28一维抛物型方程的模型初边值问题可以表示为: u_t = a * u_xx + f(x, t), 0 , t > 0, 其中,u(x, t)是未知函数,a是正常数,表示热传导系数。f(x, t)是已知的源项函数,L是空间域的长度,t代表时间。初边值条件...
- 没有解决我的问题, 去提问


问题事件
 系统已结题
10月1日
系统已结题
10月1日 已采纳回答
9月23日
已采纳回答
9月23日-
修改了问题
9月22日
-
创建了问题
9月22日