

1.添加网格
2.设置网标
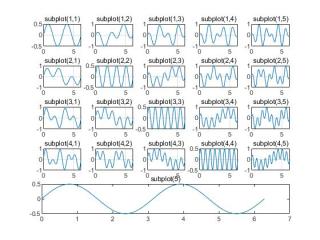
3.分割成m*n+1个子图,最后一个子图要在最后行居中

 分享
分享
你好,比如m=4,n=5
t = linspace(0,2*pi,100);
m=4;
n = 5;
for i=1:m
    for j = 1:n
        subplot(m+1,n,(i-1)*n+j)
        plot(t,sin(i*t).*cos(j*t))
        title(['subplot(',num2str(i),',',num2str(j),')'])
        grid on
    end
end
subplot(m+1,n,m*n+(1:n))
plot(t, sin(t).*cos(t))
title(['subplot(',num2str(m+1),')'])
效果
分享 系统已结题
10月3日
系统已结题
10月3日 已采纳回答
9月25日
创建了问题
9月24日
已采纳回答
9月25日
创建了问题
9月24日


