
先贴代码和图
#—*— coding utf-8 -*-
'''
Created on Wed 27 10:22:00 2019
@auther WYL
'''
import numpy as np
import matplotlib.pyplot as plt
import netCDF4 as nc
obj = nc.Dataset('f:/merra2/W/MERRA2_400.inst3_3d_asm_Np.20120601.SUB.nc4')
lat = obj.variables['lat'][:]
lev = obj.variables['lev'][0:20]
lon = obj.variables['lon'][220:280]
time= obj.variables['time'][0]
W   = obj.variables['OMEGA'][0,0:20,100,220:280]
obj2 = nc.Dataset("f:/merra2/QV/MERRA2_400.inst3_3d_asm_Np.20120/
                                                                610.SUB.nc4")
time_bnds = obj2.variables['time_bnds'][:]
time1 = obj2.variables['time'][0]
lev1 = obj2.variables['lev'][0:20]
lat1 = obj2.variables['lat'][:]
lon1 = obj2.variables['lon'][220:280]
QV = obj2.variables['QV'][0,0:20,100,220:280]
QV = QV*1000
plt.figure(figsize=(12,6))
plt.semilogy()#取对数坐标
plt.gca().invert_yaxis()#Y轴坐标反转
lons,levs=np.meshgrid(lon,lev)
x,y = lons,levs    #W=np.arange(-0.3,0,0.05)
shade = plt.contour(x,y,Welem,5,colors='k')
shade1= plt.contourf(x,y,QV,10,cmap='jet')
plt.colorbar(shade1)
plt.clabel(shade,inline=1,fontsize=10)
plt.rcParams['font.sans-serif']=['SimHei']
plt.rcParams['axes.unicode_minus'] = False
plt.title('35°N垂直速度、水汽叠加图(垂直速度:Pa·s﹣,水汽:g·kg﹣1)')
plt.show()
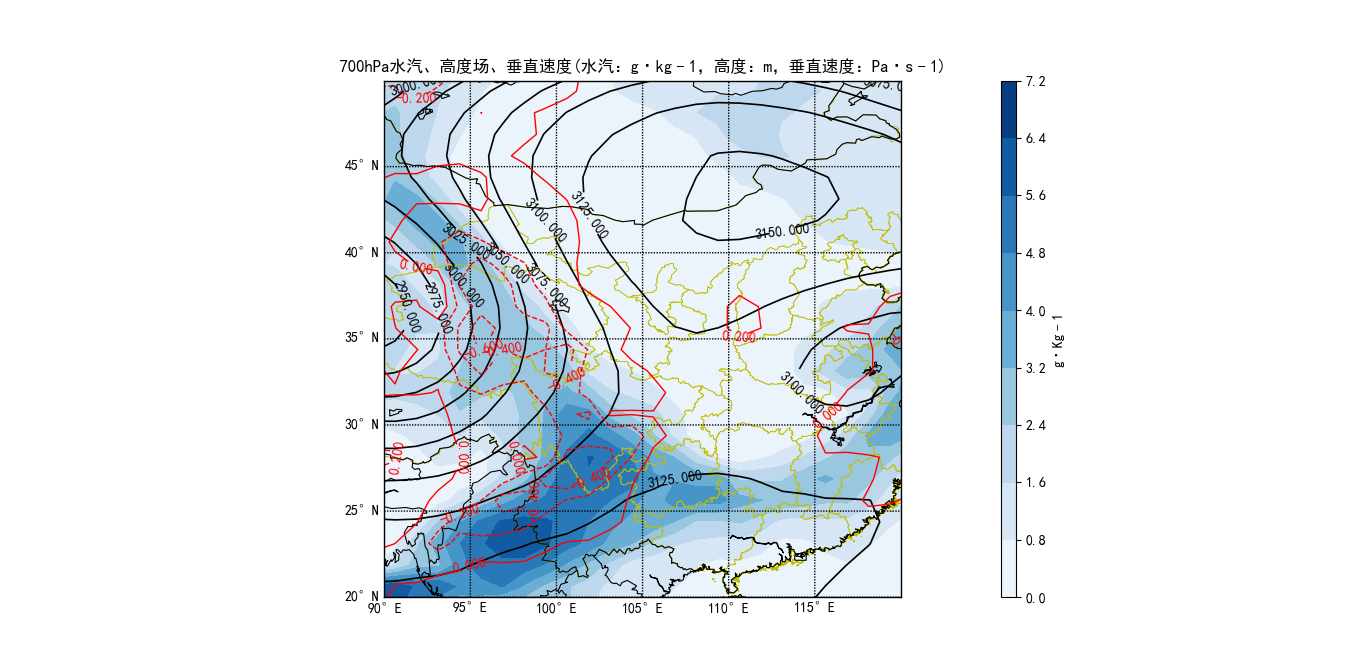
请问如何在显示等值线时只显示小于零的部分,即红色只显示虚线的数据。在线等,急


