我想实现父组件中调用子组件draw.vue来绘制图,但总是报警,无法画图。请帮助看一下错在哪里,谢谢!
代码如下:
main.js:
import * as echarts from 'echarts' //引入echarts

Vue.prototype.$echarts = echarts
在主界面中写入:
<draw></draw>
并写:
components: {
    draw
  },
最后编写子组件draw.vue:
<template>
  <div class="chart-container" ref="chart1"></div>
</template>

<script>
<template>
  <div class="chart-container" ref="chart1"></div>
</template>

<script>
let myChart = this.$echarts.init(this.$refs.chart1);

let option;

option = {
  xAxis: {},
  yAxis: {},
  series: [
    {
      symbolSize: 20,
      data: [
        [10.0, 8.04],
        [8.07, 6.95],
        [13.0, 7.58],
        [9.05, 8.81],
        [11.0, 8.33],
        [14.0, 7.66],
        [13.4, 6.81],
        [10.0, 6.33],
        [14.0, 8.96],
        [12.5, 6.82],
        [9.15, 7.2],
        [11.5, 7.2],
        [3.03, 4.23],
        [12.2, 7.83],
        [2.02, 4.47],
        [1.05, 3.33],
        [4.05, 4.96],
        [6.03, 7.24],
        [12.0, 6.26],
        [12.0, 8.84],
        [7.08, 5.82],
        [5.02, 5.68]
      ],
      type: 'scatter'
    }
  ]
};

option && myChart.setOption(option);

</script>

<style lang="scss" scoped>
 .chart-container{
   width: 100%;
   height: 100%;
 }
</style>
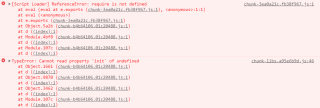
运行后有报警: