
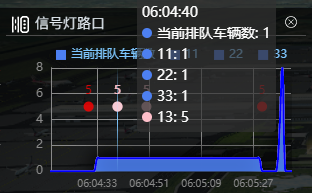
如图片
1.我折线图每一条折线的数据都有十万+(两日的时间以秒返回的数据),当只有一条数据的时候不卡,datazoom缩放和滑动都没问题,我把数据加到四条的时候datazoom缩放和滑动都很卡(延迟2~3秒)图表已经加入sampling: 'average'和large: true,进行优化
2.另加入散点图显示实时数据(当前秒数的数据,需要每秒刷新)
echarts版本4.9.0
附上代码
const option = {
dataZoom:{
show: true,
realtime: false,//实时刷新
type: 'inside',
start: 0,
end: 10,
xAxisIndex: [0]
},
tooltip: {
trigger: "axis",
axisPointer: {
lineStyle: {
color: {
type: "linear",
x: 0,
y: 0,
x2: 0,
y2: 1,
colorStops: [
{
offset: 0,
color: "rgba(126,199,255,0)", // 0% 处的颜色
},
{
offset: 0.5,
color: "rgba(126,199,255,1)", // 100% 处的颜色
},
{
offset: 1,
color: "rgba(126,199,255,0)", // 100% 处的颜色
},
],
global: false, // 缺省为 false
},
},
},
},
color: ["#4d80f1"],
legend: {
align: "left",
left: "15%",
top: "5%",
type: "plain",
textStyle: {
color: "#7ec7ff",
fontSize: 12,
},
icon: "rect",
itemGap: 15,
itemWidth: 10,
itemHeight: 10,
align: "auto",
data: [
{
name: "当前排队车辆数",
},
{
name: "11",
},
{
name: "22",
},
{
name: "33",
},
],
},
grid: {
top: "20%",
left: "15%",
right: "5%",
bottom: "15%",
// containLabel: true
},
xAxis: [
{
type: "category",
axisLabel: { interval: 0 },
boundaryGap: false,
axisLine: {
//坐标轴轴线相关设置。数学上的x轴
show: true,
lineStyle: {
color: "#898989",
},
},
axisLabel: {
//坐标轴刻度标签的相关设置
textStyle: {
color: "#898989",
// padding: 16,
fontSize: 10,
},
formatter: function(data) {
return data;
},
},
splitLine: {
show: true,
lineStyle: {
color: "#898989",
},
},
axisTick: {
show: false,
},
data: xLabel,
},
],
yAxis: [
{
nameTextStyle: {
color: "#7ec7ff",
fontSize: 10,
padding: 10,
},
min: 0,
// max: 2000,
// interval: 500,
splitLine: {
show: true,
lineStyle: {
color: "#898989",
},
},
axisLine: {
show: true,
lineStyle: {
color: "#898989",
},
},
axisLabel: {
show: true,
textStyle: {
color: "#898989",
},
formatter: function(value) {
if (value === 0) {
return value;
}
return value;
},
},
axisTick: {
show: false,
},
},
],
series: [
{
name: "当前排队车辆数",
type: "line",
symbol: "circle", // 默认是空心圆(中间是白色的),改成实心圆
showAllSymbol: true,
symbolSize: 0,
sampling: 'average',
large: true,
smooth: true,
lineStyle: {
normal: {
width: 2,
color: "#4d80f1", // 线条颜色
},
borderColor: "rgba(0,0,0,.4)",
},
areaStyle: {
//区域填充样式
normal: {
//线性渐变,前4个参数分别是x0,y0,x2,y2(范围0~1);相当于图形包围盒中的百分比。如果最后一个参数是‘true’,则该四个值是绝对像素位置。
color: this.$echarts.graphic.LinearGradient(
0,
0,
0,
1,
[
{
offset: 0,
color: "8ba7e5",
},
{
offset: 1,
color: "#e1e7f4",
},
],
false
),
// shadowColor: "rgba(25,163,223, 0.5)", //阴影颜色
shadowBlur: 20, //shadowBlur设图形阴影的模糊大小。配合shadowColor,shadowOffsetX/Y, 设置图形的阴影效果。
},
},
data: goToSchool,
},
{
name: "11",
type: "line",
symbol: "circle", // 默认是空心圆(中间是白色的),改成实心圆
showAllSymbol: true,
symbolSize: 0,
sampling: 'average',
large: true,
smooth: true,
lineStyle: {
normal: {
width: 2,
color: "#4d80f1", // 线条颜色
},
borderColor: "rgba(0,0,0,.4)",
},
areaStyle: {
//区域填充样式
normal: {
//线性渐变,前4个参数分别是x0,y0,x2,y2(范围0~1);相当于图形包围盒中的百分比。如果最后一个参数是‘true’,则该四个值是绝对像素位置。
color: this.$echarts.graphic.LinearGradient(
0,
0,
0,
1,
[
{
offset: 0,
color: "8ba7e5",
},
{
offset: 1,
color: "#e1e7f4",
},
],
false
),
// shadowColor: "rgba(25,163,223, 0.5)", //阴影颜色
shadowBlur: 20, //shadowBlur设图形阴影的模糊大小。配合shadowColor,shadowOffsetX/Y, 设置图形的阴影效果。
},
},
data: goToSchool,
},
{
name: "22",
type: "line",
symbol: "circle", // 默认是空心圆(中间是白色的),改成实心圆
showAllSymbol: true,
symbolSize: 0,
sampling: 'average',
large: true,
smooth: true,
lineStyle: {
normal: {
width: 2,
color: "pink", // 线条颜色
},
borderColor: "rgba(0,0,0,.4)",
},
areaStyle: {
//区域填充样式
normal: {
//线性渐变,前4个参数分别是x0,y0,x2,y2(范围0~1);相当于图形包围盒中的百分比。如果最后一个参数是‘true’,则该四个值是绝对像素位置。
color: this.$echarts.graphic.LinearGradient(
0,
0,
0,
1,
[
{
offset: 0,
color: "8ba7e5",
},
{
offset: 1,
color: "#e1e7f4",
},
],
false
),
// shadowColor: "rgba(25,163,223, 0.5)", //阴影颜色
shadowBlur: 20, //shadowBlur设图形阴影的模糊大小。配合shadowColor,shadowOffsetX/Y, 设置图形的阴影效果。
},
},
data: goToSchool,
},
{
name: "33",
type: "line",
symbol: "circle", // 默认是空心圆(中间是白色的),改成实心圆
showAllSymbol: true,
symbolSize: 0,
sampling: 'average',
large: true,
smooth: true,
lineStyle: {
normal: {
width: 2,
color: "blue", // 线条颜色
},
borderColor: "rgba(0,0,0,.4)",
},
areaStyle: {
//区域填充样式
normal: {
//线性渐变,前4个参数分别是x0,y0,x2,y2(范围0~1);相当于图形包围盒中的百分比。如果最后一个参数是‘true’,则该四个值是绝对像素位置。
color: this.$echarts.graphic.LinearGradient(
0,
0,
0,
1,
[
{
offset: 0,
color: "8ba7e5",
},
{
offset: 1,
color: "#e1e7f4",
},
],
false
),
// shadowColor: "rgba(25,163,223, 0.5)", //阴影颜色
shadowBlur: 20, //shadowBlur设图形阴影的模糊大小。配合shadowColor,shadowOffsetX/Y, 设置图形的阴影效果。
},
},
data: goToSchool,
},
{
name: '实时',
type: 'scatter',
symbol: 'circle',
color: "red",
label: {
normal: {
position:'top',
show: true,
},
},
data: [['06:05:30',5]]
},
{
name: '12',
type: 'scatter',
symbol: 'circle',
color: "red",
label: {
normal: {
position:'top',
show: true,
},
},
data: [['06:04:30',5]]
},
{
name: '13',
type: 'scatter',
symbol: 'circle',
color: "pink",
label: {
normal: {
position:'top',
show: true,
},
},
data: [['06:04:40',5]]
},
{
name: '14',
type: 'scatter',
symbol: 'circle',
color: "pink",
label: {
normal: {
position:'top',
show: true,
},
},
data: [['06:04:50',5]]
},
],
};


