animation已经关闭。
html代码
<!--
THIS EXAMPLE WAS DOWNLOADED FROM https://echarts.apache.org/examples/zh/editor.html?c=bar-tick-align
-->
<!DOCTYPE html>
<html style="height: 100%">
<head>
<meta charset="utf-8">
</head>
<body style="height: 100%; margin: 0">
<div id="container" style="height: 100%"></div>
<script type="text/javascript" src="https://cdn.jsdelivr.net/npm/echarts@5.2.1/dist/echarts.min.js"></script>
<!-- Uncomment this line if you want to dataTool extension
<script type="text/javascript" src="https://cdn.jsdelivr.net/npm/echarts@{{version}}/dist/extension/dataTool.min.js"></script>
-->
<!-- Uncomment this line if you want to use gl extension
<script type="text/javascript" src="https://cdn.jsdelivr.net/npm/echarts-gl@2/dist/echarts-gl.min.js"></script>
-->
<!-- Uncomment this line if you want to echarts-stat extension
<script type="text/javascript" src="https://cdn.jsdelivr.net/npm/echarts-stat@latest/dist/ecStat.min.js"></script>
-->
<!-- Uncomment this line if you want to use map
<script type="text/javascript" src="https://cdn.jsdelivr.net/npm/echarts@{{version}}/map/js/china.js"></script>
<script type="text/javascript" src="https://cdn.jsdelivr.net/npm/echarts@{{version}}/map/js/world.js"></script>
-->
<!-- Uncomment these two lines if you want to use bmap extension
<script type="text/javascript" src="https://api.map.baidu.com/api?v=2.0&ak=<Your Key Here>"></script>
<script type="text/javascript" src="https://cdn.jsdelivr.net/npm/echarts@{{version}}/dist/extension/bmap.min.js"></script>
-->
<script type="text/javascript">
var dom = document.getElementById("container");
var myChart = echarts.init(dom);
var app = {};
var option;
option = {
tooltip: {
trigger: 'axis',
axisPointer: {
type: 'shadow'
}
},
animation:false,
textStyle:{animation:false},
grid: {
left: '3%',
right: '4%',
bottom: '3%',
containLabel: true
},
xAxis: [
{
type: 'category',
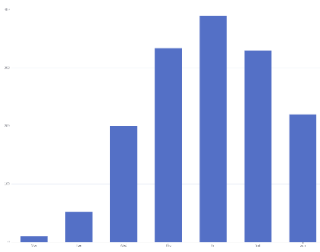
data: ['Mon', 'Tue', 'Wed', 'Thu', 'Fri', 'Sat', 'Sun'],
axisTick: {
alignWithLabel: true
}
}
],
yAxis: [
{
type: 'value'
}
],
series: [
{
name: 'Direct',
type: 'bar',
barWidth: '60%',
data: [10, 52, 200, 334, 390, 330, 220]
}
]
};
if (option && typeof option === 'object') {
myChart.setOption(option);
}
</script>
</body>
</html>
python代码
options = {"enable-local-file-access": None}
config=pdfkit.configuration(wkhtmltopdf=r"D:\wkhtmltopdf\bin\wkhtmltopdf.exe")

pdfkit.from_url("test.html",
                         "tes1t.pdf",
                         configuration=config,
                         options=options)
网页打开的样子
pdf空白