
1 plot(x,y),fplot(x,y)
x=[0:0.1:10];
y=cos(x);
plot(x,y),xlabel('x'),ylabel('cos(x)');
fplot 函数来代替,fplot 函数会绕过绘图的
时间间隔,而自动为我们决定绘图的点数。一般地,fplot 为你产生尽可能精确的的图象,
同时它也帮助我们绕过像刚才这样的错误。调用 fplot 的形式如下
fplot('function string', [xstart, xend])
或者
> t = [0:0.02:4];
>> f = exp(-2*t).*sin(t);
>> plot(t, f)
2grid on 网格,axis 设置坐标比例
y = exp(-1.5*x).*sin(5*x + 3);
>> plot(x,y), axis([0 5 -1 1])
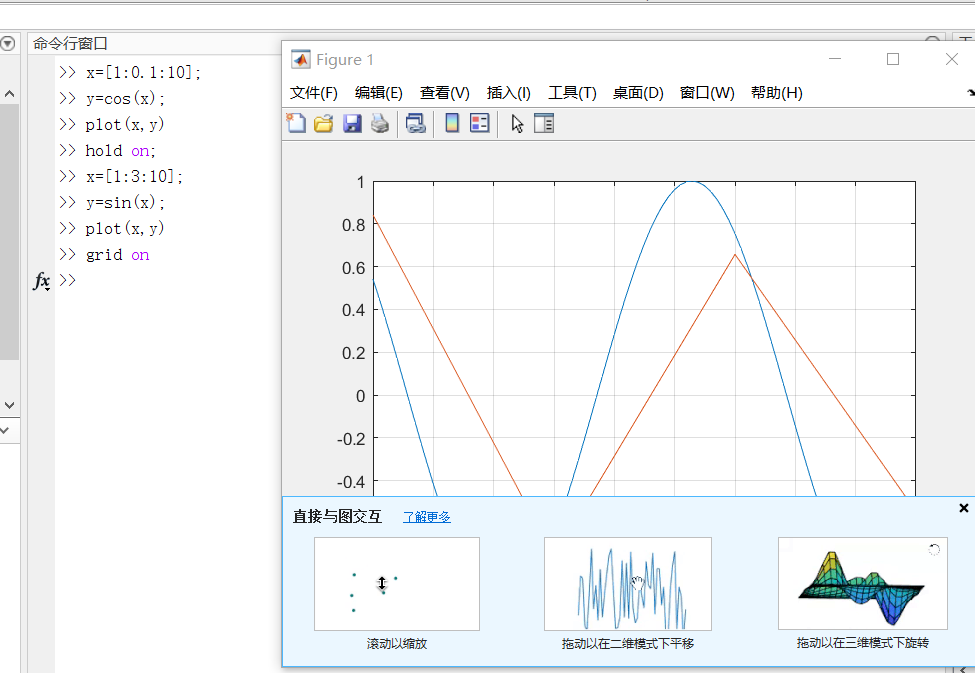
3图像重叠
hold on 的使用
x = linspace(0,2*pi);
>> plot(x, cos(x)),axis([0 2*pi -1 1])
>> hold on
>> plot(x, sin(x)), axis ([0 2*pi -1 1])
或者
t = [0:0.01:5]
f = exp(-t);
>> g = exp(-2*t);
plot(t,f,':',t,g,'--')
4 添加图例 legend
plot(x,y,x,z,'-.'), xlabel('x'), ylabel('Potential'),
>> legend('sinh(x)','cosh(x)')
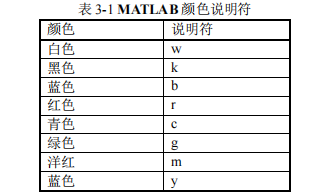
5 设置颜色plot(x,y,'r',x,z,'b--')
6 并排显示 y =e-1.2x sin(20x)和 y = e-2x sin(20x)的图象。
>> x = [0:0.01:5];
>> y = exp(-1.2*x).*sin(20*x);
>> subplot(1,2,1)%第一次调用的结果
plot(x,y),xlabel('x'),ylabel('exp(-1.2x)*sin(20x)'),
axis([0 5 -1 1]),%得到调用两个后的第一个图像
> y = exp(-2*x).*sin(20*x);
plot(x,y),xlabel('x'),ylabel('exp(–2x)*sin(20x)'), axis([0 5 -1 1])
7极坐标
a=2;
theta=[0:pi/90:2*pi);
r=a*theta;
polar(theta,r),title (‘自取')


