
import matplotlib
import matplotlib.pyplot as plt
import numpy as np
def main():
    matplotlib.rcParams['font.family'] = 'SimHei'
    stuScore = np.loadtxt('student_score.csv', delimiter=',')  # 读入成绩文件,返回数组
    sumEach = np.sum(stuScore[:, 1:], axis=1)  # 返回每个学生3门课程总分
    avgEach = np.average(stuScore[:, 1:], axis=0)  # 返回每个学生每门课程平均分
    # 取出各科成绩
    mathScore = stuScore[:, 1]
    engScore = stuScore[:, 2]
    pythonScore = stuScore[:, 3]
    # Performanceanalysis(avgEach, stuScore, sumEach)
    while True:
        print("""成绩分析与可视化系统
 1: 基本信息显示
 2: 成绩分析
 3: 可视化
 4: 退出系统""")
        operation = input("请输入你的操作")
        if operation.isdigit():
            operation = int(operation)
            if operation == 1:
                print(" 学号  高数  英语  python")
                for i in stuScore:
                    print(f"{int(i[0])} {i[1]} {i[2]} {i[3]}")
            elif operation == 2:
                Performanceanalysis(avgEach, stuScore, sumEach)
            elif operation == 3:
                # name= input("请输入课程名")
                # if name=='xxx':
                # 由于不清楚你的课程名是啥,你这里自己填 if elif else结构就可以
                Highnumberhistogram(mathScore)
                Englishhistogram(engScore)
                Scorehistogram(pythonScore)
            elif operation == 4:
                import sys
                sys.exit(0)
            else:
                print("输入错误,请重新输入")
def Performanceanalysis(avgEach, stuScore, sumEach):
    # 返回最高分和最低分
    maxMath = np.max(stuScore[:, 1])
    maxEng = np.max(stuScore[:, 2])
    maxPython = np.max(stuScore[:, 3])
    minMath = np.max(stuScore[:, 1])
    minEng = np.max(stuScore[:, 2])
    minPython = np.max(stuScore[:, 3])
    print("个人总分情况是:")
    print(sumEach)
    print("个人平均分情况是:")
    print(avgEach)
    print("班级每门课程最高分:")
    print(maxMath, maxEng, maxPython)
    print("班级每门课程最低分:")
    print(minMath, minEng, minPython)
def Highnumberhistogram(mathScore):
    # 绘制高数直方图
    plt.suptitle("成绩分布直方图")
    plt.subplot(3, 1, 1)
    plt.hist(mathScore, bins=10, range=(0, 100), color='red')  # 0-100分,分成10段
    plt.xlabel("高数成绩分数段")  # 设置x轴标签
    plt.ylabel("人数")  # 设置y轴标签
    plt.xlim(0, 100)  # 设置x轴区间
    plt.xticks([0, 10, 20, 30, 40, 50, 60, 70, 80, 90, 100])  # 设置x轴刻度
    plt.yticks([0, 10, 20, 30, 40, 50, 60, 70, 80, 90, 100])  # 设置y轴刻度
    # plt.grid()
    plt.show()
def Englishhistogram(engScore):
    # 绘制英语直方图
    plt.subplot(3, 1, 2)
    plt.hist(engScore, bins=10, range=(0, 100), color='blue')  # 0-100分,分成10段
    plt.xlabel("英语成绩分数段")  # 设置x轴标签
    plt.ylabel("人数")  # 设置y轴标签
    plt.xlim(0, 10)  # 设置x轴区间
    plt.xticks([0, 10, 20, 30, 40, 50, 60, 70, 80, 90, 100])  # 设置x轴刻度
    plt.yticks([0, 10, 20, 30, 40, 50, 60, 70, 80, 90, 100])  # 设置y轴刻度
    # plt.grid()
    plt.show()
def Scorehistogram(pythonScore):
    # 绘制python直方图
    plt.suptitle("成绩分布直方图")
    plt.subplot(3, 1, 3)
    plt.hist(pythonScore, bins=10, range=(0, 100), color='green')  # 0-100分,分成10段
    plt.xlabel("Python成绩分数段")  # 设置x轴标签
    plt.ylabel("人数")  # 设置y轴标签
    plt.xlim(0, 100)  # 设置x轴区间
    plt.xticks([0, 10, 20, 30, 40, 50, 60, 70, 80, 90, 100])  # 设置x轴刻度
    plt.yticks([0, 10, 20, 30, 40, 50, 60, 70, 80, 90, 100])  # 设置y轴刻度
    # plt.grid()
    plt.show()
if __name__ == '__main__':
    main()
加一个python的饼图 不要重复的
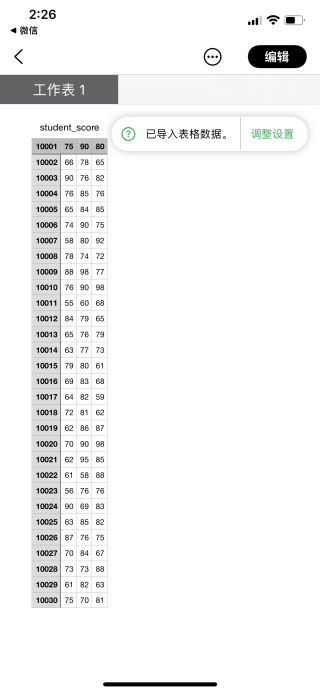
就要最后一列的那列数字 加到饼图里


