
一个前端是vue后端是java的网页应用,用户在这个应用上可以画图,画图之后的坐标、截图都会被保存至txt以及png文件中,现在我希望能够记录用户作图的时间,并且把作图的时间也同样保存下来,应该怎么做呢?
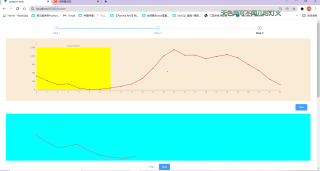
这是程序的截图:
这是前端的代码
```javascript
<template>
  <div class="container">

    <div class="step">
      <el-steps :active="active" align-center>
        <el-step title="Step 1"></el-step>
        <el-step title="Step 2"></el-step>
        <el-step title="Step 3"></el-step>
      </el-steps>
    </div>


    <div class="step-container" v-if="active === 1">
      <el-cascader
          v-model="option"
          :options="options"
          @change="handleDatasetChange"></el-cascader>
      <el-button class="el-button--primary" @click="toDraw" style="margin-left: 20px">Next</el-button>
    </div>

    <div class="step-container" v-if="active === 2" ref="screenshot">
      <div id="chartLine" class="graph"></div>
      <div class="tool">
        <el-button type="primary" @click="clear">Clear</el-button>
      </div>
      <canvas ref="canvas" id="canvas" class="draw"></canvas>
      <div ref="div" class="btn-group">
        <el-button @click="toLoad">Prev</el-button>
        <el-button class="el-button--primary" @click="toSurvey">Next</el-button>
      </div>
    </div>

    <div class="step-container" v-if="active === 3">
      <el-form ref="survey" :model="survey" label-width="400px" label-position="left">
        <el-form-item label="Age">
          <el-select v-model="survey.age" placeholder="Please select age">
            <el-option label="x < 20" value="1"></el-option>
            <el-option label="20 <= x < 25" value="2"></el-option>
            <el-option label="25 <= x < 30" value="3"></el-option>
            <el-option label="30 <= x < 35" value="4"></el-option>
            <el-option label="35 <= x < 40" value="5"></el-option>
            <el-option label="x >= 40" value="6"></el-option>
          </el-select>
        </el-form-item>
        <el-form-item label="Gender">
          <el-select v-model="survey.gender" placeholder="Please select gender">
            <el-option label="MALE" value="1"></el-option>
            <el-option label="FEMALE" value="2"></el-option>
          </el-select>
        </el-form-item>
        <el-form-item label="Working Field">
          <el-input v-model="survey.workingField" placeholder="Please input your working field"></el-input>
        </el-form-item>
        <el-form-item label="Difficulty">
          <el-select v-model="survey.difficulty" placeholder="Please select difficulty(5 is for extremely difficult)">
            <el-option label="1" value="1"></el-option>
            <el-option label="2" value="2"></el-option>
            <el-option label="3" value="3"></el-option>
            <el-option label="4" value="4"></el-option>
            <el-option label="5" value="5"></el-option>
          </el-select>
        </el-form-item>
        <el-form-item label="Do you use time series data in your work?">
          <el-select v-model="survey.used">
            <el-option label="NO" value="0"></el-option>
            <el-option label="YES" value="1"></el-option>
          </el-select>
        </el-form-item>
        <el-form-item label="Your opinion">
          <el-input type="textarea" v-model="survey.opinion"
                    placeholder="Please input your feelings about drawing the highlighted pattern"></el-input>
        </el-form-item>
        <el-form-item>
          <el-button @click="toDraw">Prev</el-button>
          <el-button type="primary" @click="submit">Submit</el-button>
        </el-form-item>
      </el-form>
    </div>

  </div>
</template>

<script>

window.addEventListener('beforeunload', function (event) {
  let message = 'You have uncompleted form.Do you want to close window?';
  if (typeof event == 'undefined') {
    event = window.event;
  }
  if (event) {
    event.returnValue = message;
  }
  return message;
});

import {fabric} from 'fabric'
import html2canvas from 'html2canvas';
import {queryOptions, insertRectPoints, insertDrawPoints, insertSurvey, uploadScreenshot} from "@/api/home";
import * as echarts from 'echarts';

require('echarts/theme/shine');
export default {
  name: 'Home',
  data() {
    return {
      active: 1,
      option: '',
      options: [],
      chartPoints: [],
      chartLine: null,
      drawPoints: [],

      fabricObj: null,
      drawingObject: null,
      mouseFrom: {},
      mouseTo: {},
      isDrawing: false,
      drawColor: '#E34F51',
      drawWidth: 2,

      survey: {},
      csvFileName: '',
      serial: 0,

      minX: 0,
      maxX: 0,
      rectPoints: [],

      img: ''
    }
  },

  created() {
    window.addEventListener('beforeunload', this.closeWindow)
  },
  mounted() {
    this.getOptions();
  },
  computed: {
    canvasWidth() {
      return window.innerWidth * (0.95)
    }
  },
  methods: {
    closeWindow() {

    },
    handleDatasetChange(val) {
      this.chartPoints = this.options[val[0]].children[val[1]].children[val[2]].points;
      this.serial = parseInt(val[2]);
      this.csvFileName = this.options[val[0]].children[val[1]].label;
      this.option = val;
    },
    async getOptions() {
      let params = {}
      let res = await queryOptions(params);
      this.options = res;
      console.log(res);
    },
    toDraw() {
      if (this.chartPoints.length === 0) {
        this.$message.warning("Please select data set first");
        return;
      }
      this.active = 2;
      this.$nextTick(function () {
        this.drawLineChart();
        this.initCanvas();
      })
    },
    toLoad() {
      this.active = 1;
    },
    toSurvey() {
      if (this.drawPoints.length === 0) {
        this.$message.warning("Please draw line first");
        return;
      }
      this.screenShot();
      this.active = 3;
    },
    drawLineChart() {
      this.chartLine = echarts.init(document.getElementById("chartLine"), 'shine');
      console.log("option", this.option);
      if (this.option[0] === '0' && this.option[1] === '0' && this.option[2] === '0') {
        this.minX = 260;
        this.maxX = this.minX + (this.chartPoints.length * 0.3);
      }

      let option = {
        tooltip: {
          trigger: 'axis'
        },
        legend: {
          data: ['Data']
        },
        calculable: true,
        xAxis: [
          {
            type: 'category',
            boundaryGap: false,
            axisTick: {
              show: false
            }
          }
        ],
        yAxis: [
          {
            type: 'value',
            axisTick: {
              show: false
            },
            name: 'Y'
          }
        ],
        series: [
          {
            name: 'Y',
            type: 'line',
            data: this.chartPoints,
            markArea: {
              itemStyle: {
                color: 'yellow'
              },
              data: [
                [
                  {
                    name: 'Drawing Area',
                    xAxis: this.minX
                  },
                  {
                    xAxis: this.maxX
                  }
                ],
              ]
            }
          }
        ]
      };
      this.chartLine.setOption(option);
    },

    initCanvas() {
      this.fabricObj = new fabric.Canvas('canvas', {
        isDrawingMode: true,
        selectable: false,
        selection: false,
        devicePixelRatio: true
      })
      this.fabricObj.freeDrawingBrush.color = '#E34F51'
      this.fabricObj.freeDrawingBrush.width = 2
      this.fabricObj.setWidth(this.canvasWidth)
      this.fabricObj.setHeight(300)
      //add events
      this.fabricObjAddEvent()
    },

    fabricObjAddEvent() {
      this.fabricObj.on({
        'mouse:down': (o) => {
          this.mouseFrom.x = o.pointer.x;
          this.mouseFrom.y = o.pointer.y;
          this.isDrawing = true;
          this.savePoints(this.mouseFrom.x, this.mouseFrom.y);
        },
        'mouse:up': (o) => {
          this.mouseTo.x = o.pointer.x;
          this.mouseTo.y = o.pointer.y;
          this.drawingObject = null;
          this.isDrawing = false;
          this.savePoints(this.mouseTo.x, this.mouseTo.y);
          console.log("Draw point", this.drawPoints)
        },
        'mouse:move': (o) => {
          if (!this.isDrawing) {
            return
          }
          this.mouseTo.x = o.pointer.x;
          this.mouseTo.y = o.pointer.y;
          this.savePoints(this.mouseTo.x, this.mouseTo.y);
        }
      });
    },
    //save history
    savePoints(x, y) {
      y = 1.5 - 0.01 * y;
      let point = {x: x, y: y};
      this.drawPoints.push(point);
    },
    clear() {
      this.drawPoints = [];
      this.fabricObj.clear();
    },
    screenShot() {
      html2canvas(this.$refs.screenshot, {
        width: window.innerWidth * 0.8 || document.documentElement.clientWidth || document.body.clientWidth,
        height: window.innerHeight || document.documentElement.clientHeight || document.body.clientHeight,
      }).then((canvas) => {
        this.img = canvas.toDataURL('image/jpeg');
        console.log(this.img);
        this.submitScreenshot();
      })
    },
    submit() {
      if (!this.survey.age) {
        this.$message.warning("Please select your age");
        return;
      }
      if (!this.survey.gender) {
        this.$message.warning("Please select your gender");
        return;
      }
      if (!this.survey.workingField) {
        this.$message.warning("Please input your working field");
        return;
      }
      if (!this.survey.difficulty) {
        this.$message.warning("Please select your difficulty");
        return;
      }
      if (!this.survey.used) {
        this.$message.warning("Please select your usage");
        return;
      }
      if (!this.survey.opinion) {
        this.$message.warning("Please input your opinion");
        return;
      }
      this.submitDrawPoints();
      this.submitRectPoints();
      this.submitSurvey();
      this.drawPoints = [];
      this.survey.difficulty = "";
      this.survey.opinion = "";
      this.$message.success("Complete successfully");
      this.img = "";
    },
    async submitRectPoints() {
      for (let i = 0; i < this.chartPoints.length; i++) {
        let point = {x: 0, y: 0}
        if (this.minX <= i && i <= this.maxX) {
          point.x = i;
          point.y = this.chartPoints[i];
          this.rectPoints.push(point);
        }
      }
      let params = {
        csvFileName: this.csvFileName,
        serial: this.serial + 1,
        date: new Date(),
        type: "rectPoints",
        points: this.rectPoints
      }
      let res = await insertRectPoints(params);
      console.log("insert rect chartPoints result", res);

    },
    async submitDrawPoints() {
      let params = {
        csvFileName: this.csvFileName,
        serial: this.serial + 1,
        date: new Date(),
        type: "drawPoints",
        points: this.drawPoints
      }

      let res = await insertDrawPoints(params);
      console.log("insert draw chartPoints result", res);
    },
    async submitSurvey() {
      let params = {
        csvFileName: this.csvFileName,
        serial: this.serial + 1,
        date: new Date(),
        type: "survey",
        survey: this.survey
      }

      let res = await insertSurvey(params);
      console.log(res);
      this.active = 1;
    },
    async submitScreenshot() {
      let params = {
        csvFileName: this.csvFileName,
        serial: this.serial + 1,
        date: new Date(),
        type: "screenshot",
        base64: this.img
      }

      let res = await uploadScreenshot(params);
      console.log("Upload screenshot result", res);
    }
  }
}
</script>


<style scoped>
.container {
  width: 95vw;
  height: 95vh;
  display: flex;
  flex-direction: column;
  align-items: center;
}

.step {
  width: 100%;
  padding: 20px 10px;
  height: 200px;
}

.step-container {
  width: 100%;
  padding: 0 20px;
}


.graph {
  background-color: antiquewhite;
  height: 400px;
}

.tool {
  padding: 20px;
  display: flex;
  justify-content: flex-end;
}

.draw {
  background-color: aqua;
  height: 400px;
}

.btn-group {
  margin-top: 20px;
}
</style>

<style>
.el-select {
  width: 100%;
}
</style>
```


