

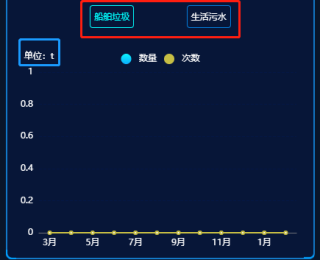
项目里的ECharts图表根据红框按钮的不同,第一个按钮要显示单位t,第二个按钮要显示单位m³。怎么样才能显示不同的数呢?
boatpollTypeOption: {
        backgroundColor: "transparent",
        tooltip: { // 提示框,鼠标悬浮交互时的信息提示
          trigger: "axis",
          axisPointer: { // 坐标轴指示器,坐标轴触发有效
            type: "cross",
            crossStyle: {
              color: "#999",
            },
          },
        },
        legend: {
          data: ["数量", "次数", ],
          textStyle: {
            color: "#fff",
          },
          icon: "circle",
        },
        xAxis: [
          {
            type: "category",
            data: ["1", "2", "3", "4", "5", "6", "7", "8", "9", "10", "11", "12" ],
            axisPointer: {
              type: "shadow",
            },
            axisLabel: {
              color: "#fff",
            },
            axisTick: { // x轴刻度线隐藏
              show: false,
            },
          },
        ],
        yAxis: {
          type: "value",
          name: "单位:t",
          nameTextStyle:{
            color:'#fff'
          },
          axisLabel: {
            formatter: "{value}",

          },
          splitLine: {
            lineStyle: { // y轴字体颜色
              type: "dashed",
              color: "#041746",
            },
          },
          axisLabel: {
            color: "#fff",
          },
        },
        series: [
          {
            name: "数量",
            type: "bar",
            tooltip: {
              valueFormatter: function (value) {
                return value + " ml";
              },
            },
            data: [220.0, 2.0, 9.3, 2.5, 2.3, 10.2, 9.3],
            itemStyle: {
              color: this.$echarts.graphic.LinearGradient(0, 0, 0, 1, [
                {
                  offset: 0,
                  color: "#0BF4FD",
                },
                {
                  offset: 1,
                  color: "#0BADFD",
                },
              ]),
              borderRadius: [50, 50, 0, 0],
            },
          },
          {
            name: "次数",
            type: "line",
            smooth: 0.5,
            tooltip: {
              valueFormatter: function (value) {
                return value + " °C";
              },
            },
            data: [2.0, 2.2, 3.3, 4.5, 6.3, 10.2, 0.3],
            itemStyle: {
              color: "#C6BE44",
            },
          },
        ],
        grid: {
          top: 30,
          left: 40,
          right: 20,
          bottom: 30,
        },
      },

getData() {
      pollutionPreventionReceiveHistoricalTrend(this.listQuery).then((res) => {
        const arr_m = [];
        const arr_v = [];
        const arr_x = [];
        res.data.map((i) => {
          arr_m.push(i.time);
          arr_v.push(i.amount);
          arr_x.push(i.count);
        });
        this.boatpollTypeOption.xAxis[0].data = arr_m;
        this.boatpollTypeOption.series[0].data = arr_v;
        this.boatpollTypeOption.series[1].data = arr_x;
        console.log('this.boatpollTypeOption',this.boatpollTypeOption);
        this.polluation_type_chart_chart.setOption(this.boatpollTypeOption);
      });
    },


