weixin_41487669 2019-07-16 16:19 采纳率: 0%
浏览 630

echarts获取mysql中的数据可视化,legend怎么才能跟柱状图的颜色对应起来?

<%@ page language="java" import="java.util.*" pageEncoding="utf-8"%>
<%
    String path = request.getContextPath();
    String basePath = request.getScheme() + "://"
            + request.getServerName() + ":" + request.getServerPort()
            + path + "/";
%>

<!DOCTYPE HTML PUBLIC "-//W3C//DTD HTML 4.01 Transitional//EN">
<html>
    <head>
        <base href="<%=basePath%>">

        <title>My JSP 'echart.jsp' starting page</title>

        <meta http-equiv="pragma" content="no-cache">
        <meta http-equiv="cache-control" content="no-cache">
        <meta http-equiv="expires" content="0">
        <meta http-equiv="keywords" content="keyword1,keyword2,keyword3">
        <meta http-equiv="description" content="This is my page">
        <!--
    <link rel="stylesheet" type="text/css" href="styles.css">
    -->
        <script type="text/javascript"
            src="http://echarts.baidu.com/build/dist/echarts.js"></script>
        <script type="text/javascript" src="jquery.min.js"></script>
        <script type="text/javascript">
    // 路径配置
    require.config({
        paths : {
            echarts : 'http://echarts.baidu.com/build/dist'
        }
    });

    // 使用
    require([ 'echarts', 'echarts/chart/bar' ,'echarts/chart/line'// 使用柱状图就加载bar模块,按需加载
    ], 
    drewEcharts
    );

       function drewEcharts(ec) {
        // 基于准备好的dom,初始化echarts图表
        var myChart = ec.init(document.getElementById('main'));
        var option = {
                color: ['#008b00', '#ffff00', '#ff7f00', '#cd0000','#0000cd'],//绿色,黄色,橙色,红色,蓝色
                title:{
                    text: 'DECG',
                    subtext: '物理量待定'
                    },
                //提示样式
                tooltip : {
                    show : true,
                    trigger: 'axis',
                    axisPointer: { //坐标轴指示器
                        crossStyle: {
                            color: '#999'
                        }
                    }
                },
                legend : {
                    data: [{name: 'Good',textStyle:{color: '#008b00'}},
                            {name:'Watch',textStyle:{color: '#ffff00'}},
                            {name: 'Warning',textStyle:{color:'#ff7f00'}},
                            {name:'Abnormal value',textStyle:{color:'#cd0000'}},
                            {name:'Baseline',textStyle:{color:'#0000cd'}}
                    ],
                    orient: 'horizontal',
                    x: 'center',
                    y: 'bottom',
                    padding: 0,
                    itemWidth: 10,
                    textStyle: {
                        fontWeight: 'bold',
                        fontSize:14
                    }
                },
                grid: {
                    left: '3%',
                    right: '2%',
                    top: '8%',
                    bottom: '2%',
                    containLable: true
                },
                toolbox: {
                    show : true,
                    feature : {
                        dataView : {show: true, readOnly: false},
                        magicType : {show: true, type: ['line', 'bar']},
                        restore : {show: true},
                        saveAsImage : {show: true}
                    }
                },
                calculable : true,
                xAxis : [ {
                    type : 'category',
                    //设置轴线属性
                    axisLine:{
                        lineStyle:{
                            color: '#4d4d4d'
                        }
                    },
                    axisLabel: { //x轴字体样式
                        interval:0,
                        rotate:70,
                        margin:2,
                        textstyle: {
                            color:"#222",
                            fontSize: '16'
                        }},
                    data :(function(){
                                    var arr=[];
                                        $.ajax({
                                        type : "post",
                                        async : false, //同步执行
                                        url : "bar.do", //web.xl中注册的Servlet的url-pattern
                                        data : {},
                                        dataType : "json", //返回数据形式为json
                                        success : function(result) {
                                        if (result) {
                                               for(var i=0;i<result.length;i++){
                                                  console.log(result[i].name);
                                                  arr.push(result[i].name);
                                                }    
                                        }

                                    },
                                    error : function(errorMsg) {
                                        alert("图表请求数据失败!");
                                        myChart.hideLoading();
                                    }
                                   })
                                   return arr;
                                })() 

                }],
                yAxis : [ {
                    type : 'value',
                    name: 'F/N',
                    nameTextStyle:{//坐标轴标签设置
                        fontWeight: 'bold',
                        fontiSize: '28'
                    },
                    interval: 10,
                    fontSize: '20',
                    axisLine: {
                        lineStyle:{
                            color: '#4d4d4d'
                        }
                    },
                    axisLabel: {//y轴字体样式
                        formatter: '{value}',
                        textStyle: {
                            color:"#222",
                            fontSize: '16'
                        }
                    }
                }],
                series : [{
                    name : 'Good',
                    type : 'bar',
                    barGap: '1%',
                    barCategoryGap: '10%',
                    itemStyle:{
                        normal:{
                            color: function(params){
                                var index_num = params.data;
                                //alert(param.value);
                                if (index_num < 30){
                                    return '#008b00'; //绿色
                                }else if (index_num>=30 && index_num<50){
                                    return '#ffff00'; //黄色
                                }else if (index_num>=50 && index_num<60){
                                    return '#ff7f00'; //橙色
                                }else{
                                     return '#cd0000'; //红色
                                }
                            }
                      },
                    },
                //barWidth: 10,
                    data :(function(){
                        var arr=[];
                         $.ajax({
                            type : "post",
                            async : false, //同步执行
                            url : "bar.do",
                            data : {},
                            dataType : "json", //返回数据形式为json
                            success : function(result) {
                                if (result) {
                                    for(var i=0;i<result.length;i++){
                                        console.log(result[i].num);
                                        arr.push(result[i].num);
                                    }  
                                }
                            },
                        error : function(errorMsg) {
                            alert("不好意思,大爷,图表请求数据失败啦!");
                            myChart.hideLoading();
                        }
                    })
                return arr;
                    })()
                  } ,
                  {
                      name : 'Watch',
                    type : 'bar',
                    barGap: '1%',
                    barCategoryGap: '10%',
                    itemStyle:{
                        normal:{
                            color: function(params){
                                var index_num = params.data;
                                //alert(param.value);
                                if (index_num>=30 && index_num<50){
                                    return '#ffff00'; //绿色
                                }else if (index_num < 30){
                                    return '#008b00'; //黄色
                                }else if (index_num>=50 && index_num<60){
                                    return '#ff7f00'; //橙色
                                }else{
                                     return '#cd0000'; //红色
                                }
                            }
                      },
                    },
                //barWidth: 10,
                    data :(function(){
                        var arr=[];
                             $.ajax({
                            type : "post",
                            async : false, //同步执行
                            url : "bar.do",
                            data : {},
                                dataType : "json", //返回数据形式为json
                            success : function(result) {
                                if (result) {
                                        for(var i=0;i<result.length;i++){
                                            console.log(result[i].num);
                                            arr.push(result[i].num);
                                    }  
                                }
                            },
                            error : function(errorMsg) {
                            alert("不好意思,大爷,图表请求数据失败啦!");
                            myChart.hideLoading();
                        }
                        })
                    return arr;
                        })() 
                  },
                  {
                      name : 'Warning',
                    type : 'bar',
                    barGap: '1%',
                    barCategoryGap: '10%',
                    itemStyle:{
                        normal:{
                            color: function(params){
                                var index_num = params.data;
                                //alert(param.value);
                                if (index_num < 30){
                                    return '#008b00'; //绿色
                                }else if (index_num>=30 && index_num<50){
                                    return '#ffff00'; //黄色
                                }else if (index_num>=50 && index_num<60){
                                    return '#ff7f00'; //橙色
                                }else{
                                     return '#cd0000'; //红色
                                }
                            }
                      },
                    },
                //barWidth: 10,
                    data :(function(){
                        var arr=[];
                             $.ajax({
                            type : "post",
                            async : false, //同步执行
                            url : "bar.do",
                            data : {},
                                dataType : "json", //返回数据形式为json
                            success : function(result) {
                                if (result) {
                                        for(var i=0;i<result.length;i++){
                                            console.log(result[i].num);
                                            arr.push(result[i].num);
                                    }  
                                }
                            },
                            error : function(errorMsg) {
                            alert("不好意思,大爷,图表请求数据失败啦!");
                            myChart.hideLoading();
                        }
                        })
                    return arr;
                        })()  
                  },
                  {
                      name : 'Abnormal value',
                    type : 'bar',
                    barGap: '1%',
                    barCategoryGap: '10%',
                    itemStyle:{
                        normal:{
                            color: function(params){
                                var index_num = params.data;
                                //alert(param.value);
                                if (index_num < 30){
                                    return '#008b00'; //绿色
                                }else if (index_num>=30 && index_num<50){
                                    return '#ffff00'; //黄色
                                }else if (index_num>=50 && index_num<60){
                                    return '#ff7f00'; //橙色
                                }else{
                                     return '#cd0000'; //红色
                                }
                            }
                      },
                    },
                //barWidth: 10,
                    data :(function(){
                        var arr=[];
                             $.ajax({
                            type : "post",
                            async : false, //同步执行
                            url : "bar.do",
                            data : {},
                                dataType : "json", //返回数据形式为json
                            success : function(result) {
                                if (result) {
                                        for(var i=0;i<result.length;i++){
                                            console.log(result[i].num);
                                            arr.push(result[i].num);
                                    }  
                                }
                            },
                            error : function(errorMsg) {
                            alert("不好意思,大爷,图表请求数据失败啦!");
                            myChart.hideLoading();
                        }
                        })
                    return arr;
                        })()  
                  },
                {
                    name: 'Baseline',
                    type: 'line',
                    smooth:true,
                    yAxisIndex: 0,
                    symbolSize:0, //拐点圆的大小
                    itemStyle:{
                        normal:{
                        color: '#0000cd',
                        }
                },
                data: [53,30,29,40,18,30,9,17,64,30,48,12,30,38,20,31,38,53,38,51,9,17]
            }
        ],
            //控制每次只显示固定柱子数目
            dataZoom:[{
                 type:'inside',//inside,slider此处只列举inside
                 start:0,
                 end:9,//dataZoom-inside.start 和 dataZoom-inside.end 共同用 百分比 的形式定义了数据窗口范围。
                 xAxisIndex:0,//不指定时,当 dataZoom-inside.orient 为 'horizontal'时,默认控制和 dataZoom 平行的第一个 xAxis。但是不建议使用默认值,建议显式指定。
                filterMode:'none',//dataZoom 的运行原理是通过 数据过滤 来达到 数据窗口缩放 的效果。数据过滤模式的设置不同,效果也不同。('filter','weakfilter','empty','none')http://echarts.baidu.com/option.html#dataZoom-inside
                zoomLock:true,//只能拖动不可缩放,若无需禁止缩放设置为false或者去除即可
            }]
      };

        myChart.setOption(option);

        // 为echarts对象加载数据 
        myChart.setOption(option);

    }
  sideBarChart.resize();//修改echarts容器大小
</script>
</head>
<body>
        <div id="main" style="height: 550px; width: 1100px"></div> 
     </body>
</html>

在mysql中取出数据后,按照数值范围对数据进行分类,不同类别的数据显示不同颜色的柱子。
实现结果:
图片说明

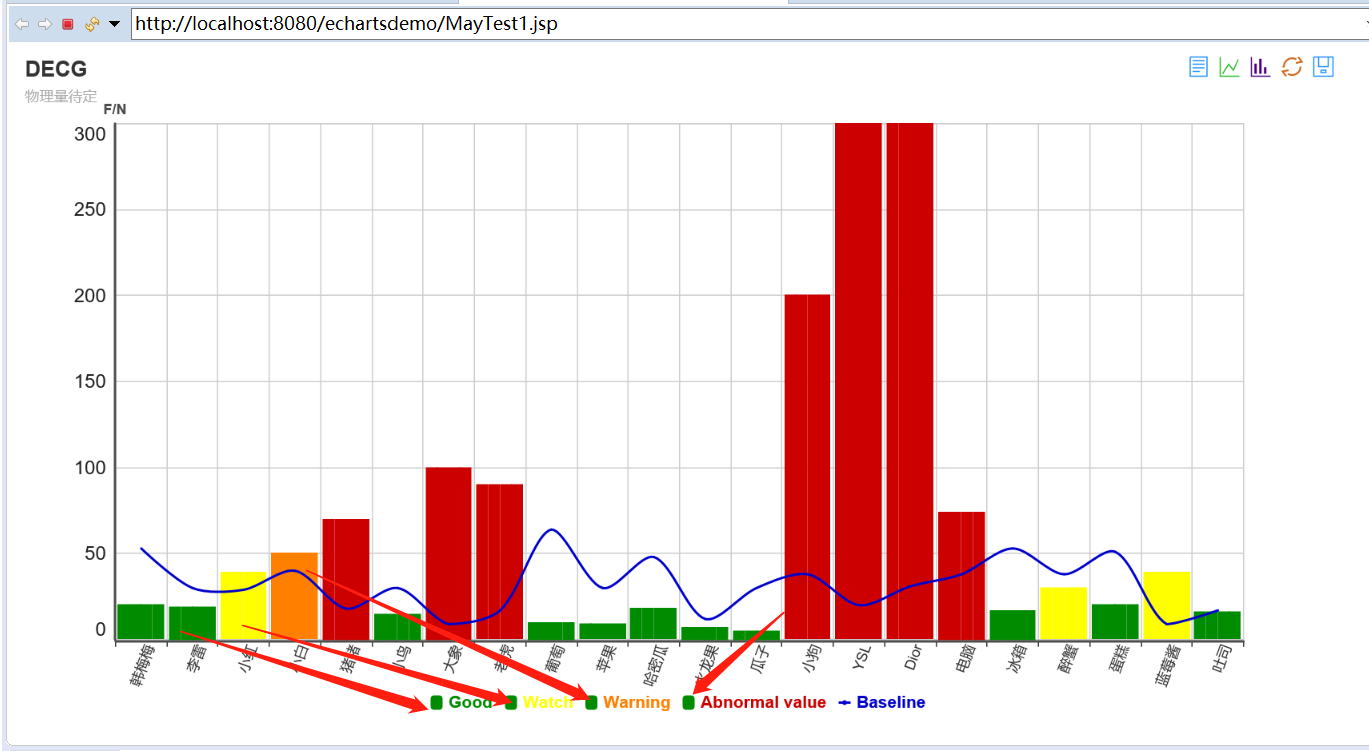
求教大神 怎么修改代码,让legend显示与柱子对应的颜色?

  • 写回答

1条回答 默认 最新

  • 创作中心 2023-04-20 14:57
    关注

    1、legend中数据的name属性,是根据series中name进行对应匹配的。
    2、你的这个series数组中name : 'Abnormal value'更新了好几种颜色,legend数组中的name只能匹配到 'Abnormal value'进行颜色展示。
    3、你应该series数组中想展示几个颜色就对应生成几个name,然后legend注册对应的name。就会展示对应的图标颜色了。

    评论

报告相同问题?

悬赏问题

  • ¥15 simulink仿真中dtc控制永磁同步电机如何控制开关频率
  • ¥15 用C语言输入方程怎么
  • ¥15 网站显示不安全连接问题
  • ¥15 github训练的模型参数无法下载
  • ¥15 51单片机显示器问题
  • ¥20 关于#qt#的问题:Qt代码的移植问题
  • ¥50 求图像处理的matlab方案
  • ¥50 winform中使用edge的Kiosk模式
  • ¥15 关于#python#的问题:功能监听网页
  • ¥15 怎么让wx群机器人发送音乐