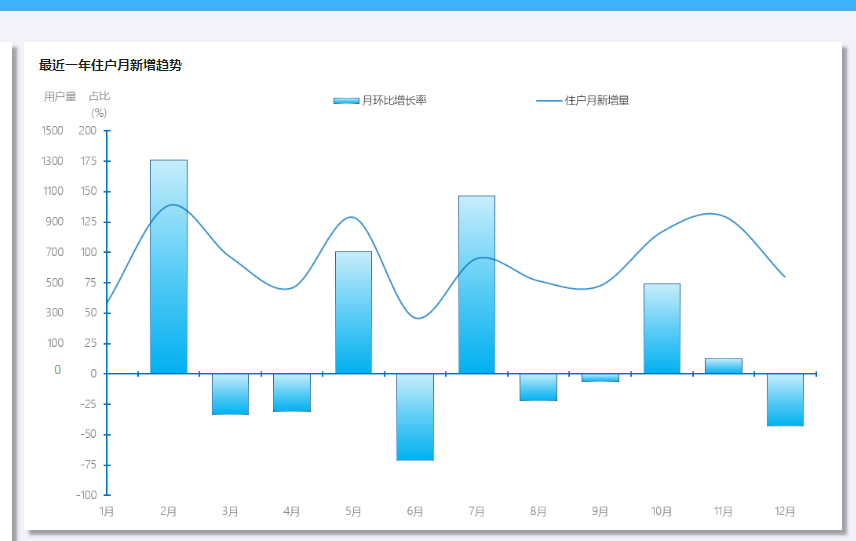
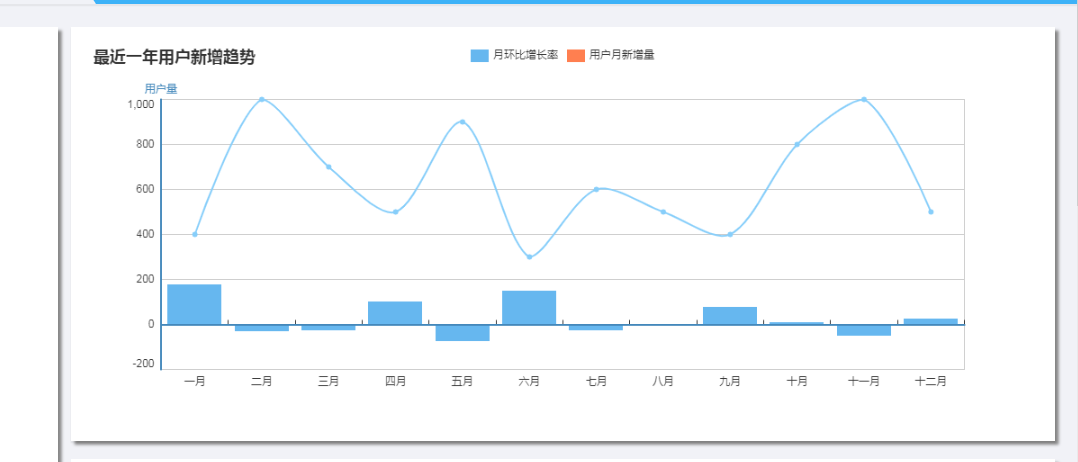
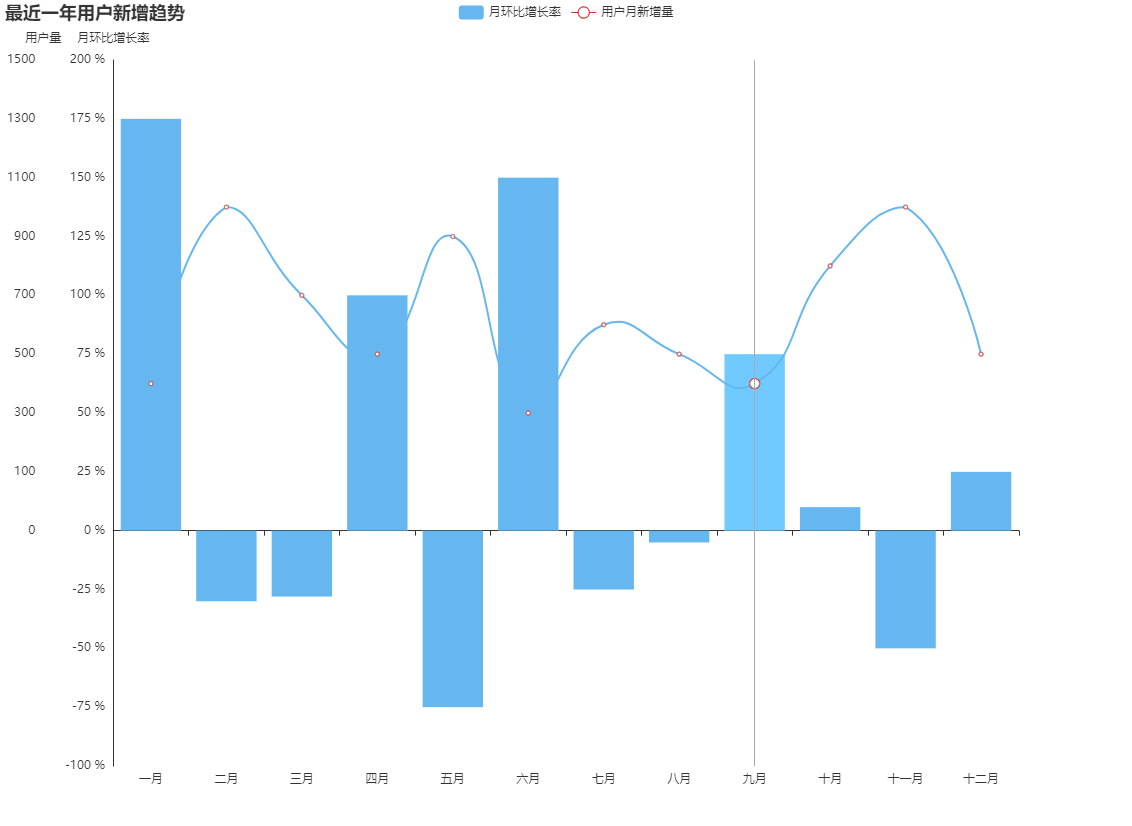
要求做成这样的 目前已经做到这样了
 ,导入的是json格式的文件
,json里面那个catego'ries没有用到,但其他的都导入进来了,目前代码如下
echartmix: function(opts){
                 var option= {
                      title: {
                    text: '最近一年用户新增趋势'

                },
                tooltip: {
                    trigger: 'axis'
                },
                legend: {
                    type: scroll,
                    data:['月环比增长率','用户月新增量']
                },
                toolbox: {
                    show: false,
                    feature: {
                        magicType: {show: true, type: ['stack', 'tiled']},
                        saveAsImage: {show: true}
                    }
                },
                xAxis: {
                    type: 'category',
                    splitLine: {
                        show: false
                    },
                    data: ['一月','二月','三月','四月','五月','六月','七月','八月','九月','十月','十一月','十二月']
                },
                yAxis: [{
                         type: 'value',
                         name: '用户量',
                         axisTick: {
                            show: false
                         }
                           },
                           {
                            type: 'value',
                            name: '月环比增长率',

                            axisLabel: {
                                formatter: '{value} %'
                            },
                            axisTick: {
                            show: false
                            }
                            }
                        ],
                series: [{
                    name: '月环比增长率',
                    type: '',
                    data: [],
                    itemStyle: {
                        normal: {
                            color: '#66b7ef'
                        }
                    }
                },
                {
                    name: '用户月新增量',
                    type: '',
                    data: [],
                    itemStyle: {
                        normal: {
                            lineStyle: {
                            color: '#66b7ef'
                          }
                        }
                    }
                }]
               };
                $.each(opts.columnSeries, function(index, item){
                    item.type = 'bar';
                    option.series.push(item)
                });
                $.each(opts.splineSeries, function(index, item){
                    item.type = 'line';
                    item.smooth = true;

                    option.series.push(item)
                });
                return option;
            }
主要难点一是第二个y轴,刻度要从-100%到200%,关键是高度要和那个柱状的月环比增长率对应,就是json里的columnseries,二是整个图表最外侧的那个边框如何删掉,三是上面那个蓝色和橙色的legend,我点蓝色的有反应,legend变灰后下面的柱状消失,但是红色那个点了只是单纯他自己变灰,图表本身没任何变化,是不是我上面legend写的有问题,我真的是被难住了,跪求大佬帮助

