
官方实例里是这样的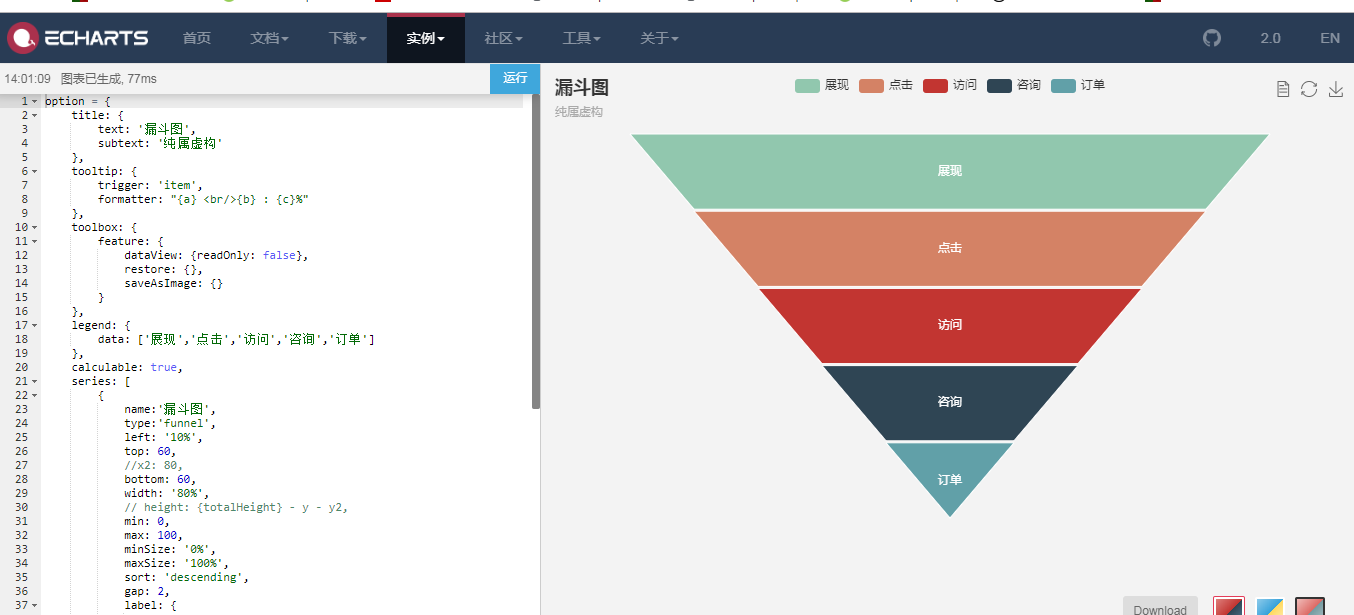 ,我放到项目里展示出来是这样的
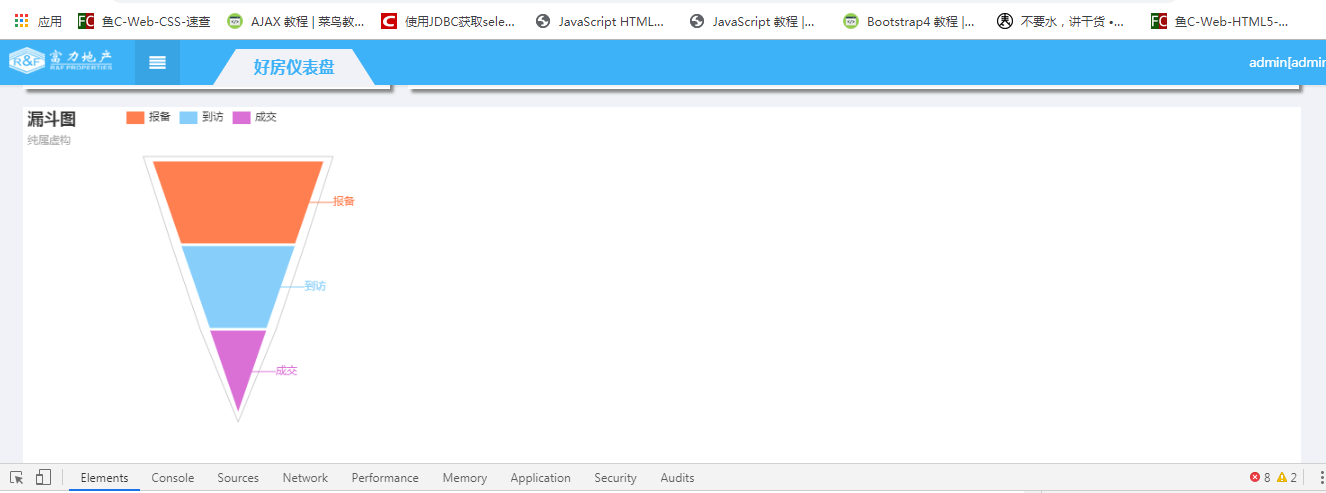 ,我数据可以和json中的格式对应上,我主要想问一下漏斗图中间的文字怎么没有了,然后该如何把图表的位置包括上面的label向左移一些,漏斗图标题可以不要,代码如下
json格式
图表代码
    echartfunnel: function(opts){
                var option = {
                     title: {
        text: '漏斗图',
        subtext: '纯属虚构'
    },
    tooltip: {
        trigger: 'item',
        formatter: "{a} <br/>{b} : {c}%"
    },
    toolbox: {
        feature: {
            dataView: {readOnly: false},
            restore: {},
            saveAsImage: {}
        }
    },
    legend: {
        data: ['报备','到访','成交']
    },
    calculable: true,
    series: [
        {
            name:'漏斗图',
            type:'funnel',
            left: '1%',
            top: 60,
            //x2: 80,
            bottom: 60,
            width: '80%',
            // height: {totalHeight} - y - y2,
            min: 0,
            max: 100,
            minSize: '0%',
            maxSize: '100%',
            sort: 'descending',
            gap: 2,
            label: {
                show: true,
                position: 'inside'
            },
            labelLine: {
                length: 10,
                lineStyle: {
                    width: 1,
                    type: 'solid'
                }
            },
            itemStyle: {
                borderColor: '#fff',
                borderWidth: 1
            },
            emphasis: {
                label: {
                    fontSize: 20
                }
            },
            data: opts.data
        }
    ]
    };
     return option;
}
html代码
<div is-echarts option="clientfunnel" style="height: 400px;width: 28%;display: inline-block;"></div>
angularjs控制器代码
    $scope.funnelClients = response.funnelClients;

                $scope.clientfunnel = charts.echartfunnel($scope.funnelClients);


