KA冉KA 2022-05-13 18:05 采纳率: 34.4%
浏览 32
已结题

echarts热力图展示

在angular项目中使用echarts的热力图,代码如下:

let dom = document.getElementById('main');
this.myChart = echarts.init(dom);
let option = {
    animation: false,
    bmap: {
        center: [120.13066322374, 30.240018034923],
        zoom: 14,
        roam: true
    },
    visualMap: {
        show: false,
        top: 'top',
        min: 0,
        max: 5,
        seriesIndex: 0,
        calculable: true,
        inRange: {
            color: ['blue', 'blue', 'green', 'yellow', 'red']
        }
    },
    series: [
        {
            type: 'heatmap',
            coordinateSystem: 'bmap',
            data: [
                [120.14322240845, 30.236064370321, 1],
                [120.14280555506, 30.23633761213, 1],
                [120.14307598649, 30.236125905084, 1],
                [120.14301682797, 30.236035316745, 1],
                [120.1428734612, 30.236160551632, 1],
                [120.14200215328, 30.23595702204, 1],
                [120.14138577045, 30.236113748704, 1],
                [120.1400398833, 30.235973050702, 1],
                [120.13893453465, 30.23517220446, 1],
                [120.1382899739, 30.234062922977, 1],
            ],
            pointSize: 5,
            blurSize: 6
        }
    ]
};
this.myChart.setOption(option);
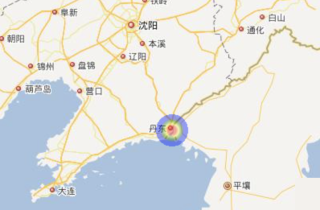
运行结果:

img

怎么实现热力图呀,用echart或百度地图都可以,只要能实现就行,请能人指点下

  • 写回答

2条回答 默认 最新

  • KA冉KA 2022-05-18 17:02
    关注

    angular + 百度地图热力图:

    
            this.map = new BMap.Map('main');
            let point = new BMap.Point(124.354706, 40.000499);
            this.map.centerAndZoom(point, 7); // 初始化地图,设置中心点坐标和地图级别
            this.map.addControl(new BMap.MapTypeControl({
                mapTypes: [
                    window['BMAP_NORMAL_MAP'],
                    window['BMAP_HYBRID_MAP']
                ]
            }));
            this.map.setCurrentCity('丹东');
            this.map.enableScrollWheelZoom(true); // 允许滚轮缩放
    
            let points = [];
            for (let i = 0; i < 1000;i++) {
                points.push(
                    {
                        lng: 124.354706 + 0.001 * Math.floor(Math.random() * 10 + 1),
                        lat: 40.000499 + 0.001 * Math.floor(Math.random() * 10 + 1),
                        count: Math.floor(Math.random() * 10 + 1),
                    }
                );
            }
    
            let script = document.createElement('script');
            script.type = 'text/javascript';
            script.src = 'http://api.map.baidu.com/library/Heatmap/2.0/src/Heatmap_min.js';
            document.body.appendChild(script);
            setTimeout(() => {
                let heatmapOverlay = new BMapLib.HeatmapOverlay({ radius: 20,opacity: 0.4,
                    gradient: {.1: 'blue', .3: 'blue', .5: 'green', .7: 'yellow', .9: 'red'}
                });
                this.map.addOverlay(heatmapOverlay);
                heatmapOverlay.setDataSet({ data: points, max: 10 });
            },2000);
    

    效果图:

    img

    本回答被题主选为最佳回答 , 对您是否有帮助呢?
    评论
查看更多回答(1条)

报告相同问题?

问题事件

  • 系统已结题 5月26日
  • 已采纳回答 5月18日
  • 修改了问题 5月13日
  • 创建了问题 5月13日

悬赏问题

  • ¥15 如何在3D高斯飞溅的渲染的场景中获得一个可控的旋转物体
  • ¥88 实在没有想法,需要个思路
  • ¥15 MATLAB报错输入参数太多
  • ¥15 python中合并修改日期相同的CSV文件并按照修改日期的名字命名文件
  • ¥15 有赏,i卡绘世画不出
  • ¥15 如何用stata画出文献中常见的安慰剂检验图
  • ¥15 c语言链表结构体数据插入
  • ¥40 使用MATLAB解答线性代数问题
  • ¥15 COCOS的问题COCOS的问题
  • ¥15 FPGA-SRIO初始化失败