
python scatter
python matplotlib scatter作图
问题相关代码,请勿粘贴截图
from matplotlib import pyplot as plt
from sklearn.cluster import KMeans
import numpy as np
x = np.array(li).reshape(-1,1)
print(x)
km = KMeans(n_clusters=3,max_iter=1000).fit(x)
Muk = km.cluster_centers_
print(Muk[:, 0])
Muk = [[13,40],[34,28],[61,12]]
y = KMeans(n_clusters=3,max_iter=1000).fit_predict(x) #会得出每个sample属于哪一类
C_i = km.predict(x)
print(C_i)
f, ax = plt.subplots(figsize=(7, 5))
colors = ['r', 'g', 'b']
for i in range(3):
ax.scatter(time_arr, day_arr, c=C_i,label="Cluster {}".format(i))
ax.scatter([13,34,61],[40,28,12], s=100, color='red',label='Center')
ax.set_title("eat")
ax.legend()
f.show()
运行结果及报错内容
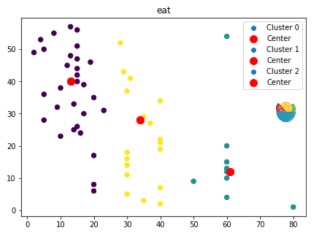
我想要达到的结果
把右上标改成正确的


