
在使用pyqt5和pyqtgraph绘制3D散点图的时候,我设置了两个窗口,实现在父窗口中根据读取文件绘制了3D图,在父窗口中成功启动子窗口。但是,当我想在子窗口中根据父窗口中读取的文件绘制3D图时报错。即,父窗口中绘制了3D图,子窗口报错;子窗口绘制了3D图,父窗口报错。
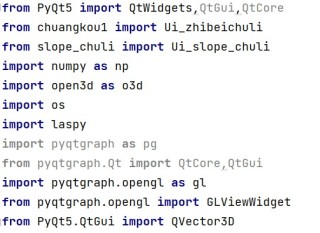
部分代码:
class MainWindow(QtWidgets.QMainWindow,Ui_zhibeichuli):#主界面
def __init__(self,parent=None):
    super(MainWindow,self).__init__(parent)
    self.setupUi(self)
    '''定义信号槽'''

    self.actionfile_PcdLas_open.triggered.connect(self.open_file_pointCloud_pcd_las)
    #self.action_exit.triggered.connect(MainWindow.close)

    self.action_save.triggered.connect(self.save_point_cloud)
    self.action_slope_chuli.triggered.connect(self.open_son_slope)
    '''初始化显示布局'''
    self.pointView = GLViewWidget()
    self.gridLayout.addWidget(self.pointView, 0, 1)
    self.grid_item = gl.GLGridItem(QVector3D(100, 100, 1))#生成网格
    self.pointView.addItem(self.grid_item)
    '''初始三维坐标'''
    self.x_axis_item = gl.GLLinePlotItem(pos=np.array([[0, 0, 0], [10, 0, 0]], dtype=np.float32),
                                         color=(1, 0, 0, 1),
                                         width=2)
    self.pointView.addItem(self.x_axis_item)
    self.y_axis_item = gl.GLLinePlotItem(pos=np.array([[0, 0, 0], [0, 10, 0]], dtype=np.float32),
                                         color=(0, 1, 0, 1),
                                         width=2)
    self.pointView.addItem(self.y_axis_item)
    self.z_axis_item = gl.GLLinePlotItem(pos=np.array([[0, 0, 0], [0, 0, 10]], dtype=np.float32),
                                         color=(0, 0, 1, 1),
                                         width=2)
    self.pointView.addItem(self.z_axis_item)
打开文件部分(父窗口):
'''槽函数,打开点云文件,*.pcd *.las'''
def open_file_pointCloud_pcd_las(self):
global slope_pos_pcd_las#存储xyz坐标
    from PyQt5.QtWidgets import QFileDialog
    dir=QFileDialog()#创建文件对话框
    dir.setFileMode(QFileDialog.ExistingFiles)#设置多选
    #设置只显示的文件类型
    dir.setNameFilter('点云文件(*.pcd *.las)')

    if dir.exec_():#判断是否选择了文件

        (raod_pcd_las_name, extension) = os.path.splitext(dir.selectedFiles()[0])#获取文件后缀
        if extension=='.pcd':
            pcd = o3d.io.read_point_cloud(dir.selectedFiles()[0])#根据文件地址读取文件
            xyz_pcd = np.array(pcd.points)#转为np数组
            #Point_Cloud_chuli().show_point_before(xyz_pcd)#显示pcd
            slope_pos_pcd_las=xyz_pcd#全局变量存储,用于坡度处理调用
            self.pointView.clear()#清除布局
            '''重新添加布局'''
            self.pointView = GLViewWidget()
            self.gridLayout.addWidget(self.pointView, 0, 1)
            self.grid_item = gl.GLGridItem(QVector3D(100, 100, 1))
            self.pointView.addItem(self.grid_item)
            points = xyz_pcd
            '''用于点云的坐标变换'''
            x_list = points[..., 0]
            y_list = points[..., 1]
            z_list = points[..., 2]
            # x, y, z = points[0, 0], points[0, 1], points[0, 2]
            x, y, z = min(x_list), min(y_list), min(z_list)
            x_trans = x_list - x
            y_trans = y_list - y
            z_trans = z_list - z
            n = len(x_trans)
            points_trans = np.zeros((n, 3))
            points_trans[..., 0] = x_trans
            points_trans[..., 1] = y_trans
            points_trans[..., 2] = z_trans
            '''坐标轴xyz'''
            self.x_axis_item = gl.GLLinePlotItem(pos=np.array([[0, 0, 0], [10, 0, 0]], dtype=np.float32),
                                                 color=(1, 0, 0, 1),
                                                 width=2)
            self.pointView.addItem(self.x_axis_item)
            self.y_axis_item = gl.GLLinePlotItem(pos=np.array([[0, 0, 0], [0, 10, 0]], dtype=np.float32),
                                                 color=(0, 1, 0, 1),
                                                 width=2)
            self.pointView.addItem(self.y_axis_item)
            self.z_axis_item = gl.GLLinePlotItem(pos=np.array([[0, 0, 0], [0, 0, 10]], dtype=np.float32),
                                                 color=(0, 0, 1, 1),
                                                 width=2)
            self.pointView.addItem(self.z_axis_item)
            '''点云显示样式'''
            colors = np.ones((n, 4))
            size = np.zeros(shape=points.shape[0])
            self.points_plot_item = gl.GLScatterPlotItem(pos=points_trans,
                                                         color=colors,
                                                         size=size,
                                                         pxMode=False)
            self.pointView.addItem(self.points_plot_item)
打开子窗口:
def open_son_slope(self):
    self.op=Son_slopeWindow()
    self.op.show()
子窗口:
class Son_slopeWindow(QtWidgets.QMainWindow,Ui_slope_chuli):
def init(self):
super(Son_slopeWindow,self).init()
self.setupUi(self)
self.pushButton.clicked.connect(self.slope_show)
'''----------'''
pcd = o3d.io.read_point_cloud("D:/desk/002.pcd")
    filtered_cloud = Point_Cloud_chuli().slope_chuli(pcd, 2, 0.5,1)

    points = np.array(filtered_cloud.points)

    '''用于点云的坐标变换'''
    x_list = points[..., 0]
    y_list = points[..., 1]
    z_list = points[..., 2]
    # x, y, z = points[0, 0], points[0, 1], points[0, 2]
    x, y, z = min(x_list), min(y_list), min(z_list)
    x_trans = x_list - x
    y_trans = y_list - y
    z_trans = z_list - z
    n = len(x_trans)

    points_trans = np.zeros((n, 3))
    points_trans[..., 0] = x_trans
    points_trans[..., 1] = y_trans
    points_trans[..., 2] = z_trans

    '''--------'''

    self.points_afterView=GLViewWidget()
    self.gridLayout_2.addWidget(self.points_afterView,0,1)

    self.grid_ite=gl.GLGridItem(QVector3D(100,100,1))
    self.points_afterView.addItem(self.grid_ite)

    self.x_axis=gl.GLLinePlotItem(pos=np.array([[0,0,0],[10,0,0]]),
                                  color=(1,0,0,1),
                                  width=2)
    self.points_afterView.addItem(self.x_axis)
    self.y_axis = gl.GLLinePlotItem(pos=np.array([[0, 0, 0], [0, 10, 0]]),
                                    color=(0, 1, 0, 1),
                                    width=2)
    self.points_afterView.addItem(self.y_axis)
    self.z_axis = gl.GLLinePlotItem(pos=np.array([[0, 0, 0], [0, 0, 10]]),
                                    color=(0, 0, 1, 1),
                                    width=2)
    self.points_afterView.addItem(self.z_axis)
    '''-----'''
    colors = np.ones((n, 4))
    size = np.zeros(n)

    self.points_plot_after = gl.GLScatterPlotItem(pos=points_trans,
                                                  color=colors,
                                                  size=size,
                                                  pxMode=False)
    self.points_afterView.addItem(self.points_plot_after)
报错类型:
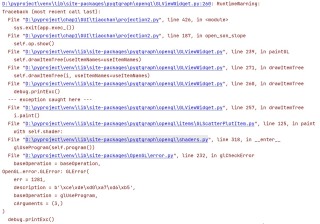
可以说明的是,文件及处理后的文件的数据没问题。


