
echarts提示框组件为什么会出现这种问题?
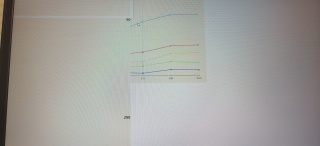
有问题图
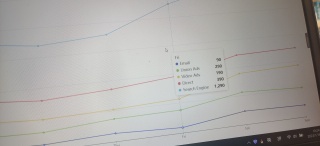
没有问题图
有问题的代码
<!DOCTYPE html>
<html lang="en">

<head>
    <meta charset="UTF-8">
    <meta http-equiv="X-UA-Compatible" content="IE=edge">
    <meta name="viewport" content="width=device-width, initial-scale=1.0">
    <title>Document</title>
    <script src="js/jquery.min.js"></script>
    <script src="js/echarts.min.js"></script>

</head>
<style>
    div {
        width: 800px;
        height: 400px;
        background-color: antiquewhite;
    }
</style>

<body>
    <div id="main"></div>
    <script>
        var chartDom = document.getElementById('main');
        var myChart = echarts.init(chartDom);
        var app = {};
        var option;

        option = {

            //标题
            title: {
                text: '表格'
            },
            //提示框组件
            tooltip: {
                trigger: 'axis',
            },
            //图例组件
            legend: {
                data: ['Email', 'Union Ads', 'Video Ads', 'Direct', 'Search Engine']
            },
            //直角坐标系内绘图网格,即整个表格就是一个内绘图网络
            //网格区域和盒子区域是两个概念
            grid: {
                left: '3%',//图表距离盒子左边百分之3的大小
                right: '4%',
                bottom: '3%',
                containLabel: true,

            },
            //工具栏组件,例如下载按钮,保存为图片
            toolbox: {
                feature: {
                    saveAsImage: {}
                }
            },
            xAxis: {
                type: 'category',
                boundaryGap: false,
                data: ['Mon', 'Tue', 'Wed', 'Thu', 'Fri', 'Sat', 'Sun']
            },
            yAxis: {
                type: 'value'
            },
            series: [
                {
                    name: 'Email',
                    type: 'line',
                    stack: 'Total',
                    data: [120, 132, 101, 134, 90, 230, 210]
                },
                {
                    name: 'Union Ads',
                    type: 'line',
                    stack: 'Total',
                    data: [220, 182, 191, 234, 290, 330, 310]
                },
                {
                    name: 'Video Ads',
                    type: 'line',
                    stack: 'Total',
                    data: [150, 232, 201, 154, 190, 330, 410]
                },
                {
                    name: 'Direct',
                    type: 'line',
                    stack: 'Total',
                    data: [320, 332, 301, 334, 390, 330, 320]
                },
                {
                    name: 'Search Engine',
                    type: 'line',
                    stack: 'Total',
                    data: [820, 932, 901, 934, 1290, 1330, 1320]
                }
            ]
        };
        if (option && typeof option === 'object') {
            myChart.setOption(option);
        }

        window.addEventListener('resize', myChart.resize);
    </script>
</body>

</html>
没有问题的代码
<!DOCTYPE html>
<html  lang="en">

<head>
    <meta charset="utf-8">
    <meta http-equiv="X-UA-Compatible" content="IE=edge">
    <meta name="viewport" content="width=device-width, initial-scale=1.0">
    <script src="js/echarts.min.js"></script>
</head>

<body >
    <div id="container"  style="height: 400px;width: 800px;"></div>

    <script type="text/javascript">
        var dom = document.getElementById('container');
        var myChart = echarts.init(dom)
        var app = {};

        var option;

        option = {
            title: {
                text: 'Stacked Line'
            },
            tooltip: {
                trigger: 'axis'
            },
            legend: {
                data: ['Email', 'Union Ads', 'Video Ads', 'Direct', 'Search Engine']
            },
            grid: {
                left: '3%',
                right: '4%',
                bottom: '3%',
                containLabel: true
            },
            toolbox: {
                feature: {
                    saveAsImage: {}
                }
            },
            xAxis: {
                type: 'category',
                boundaryGap: false,
                data: ['Mon', 'Tue', 'Wed', 'Thu', 'Fri', 'Sat', 'Sun']
            },
            yAxis: {
                type: 'value'
            },
            series: [
                {
                    name: 'Email',
                    type: 'line',
                    stack: 'Total',
                    data: [120, 132, 101, 134, 90, 230, 210]
                },
                {
                    name: 'Union Ads',
                    type: 'line',
                    stack: 'Total',
                    data: [220, 182, 191, 234, 290, 330, 310]
                },
                {
                    name: 'Video Ads',
                    type: 'line',
                    stack: 'Total',
                    data: [150, 232, 201, 154, 190, 330, 410]
                },
                {
                    name: 'Direct',
                    type: 'line',
                    stack: 'Total',
                    data: [320, 332, 301, 334, 390, 330, 320]
                },
                {
                    name: 'Search Engine',
                    type: 'line',
                    stack: 'Total',
                    data: [820, 932, 901, 934, 1290, 1330, 1320]
                }
            ]
        };


        if (option && typeof option === 'object') {
            myChart.setOption(option);
        }

        window.addEventListener('resize', myChart.resize);
    </script>
</body>

</html>


