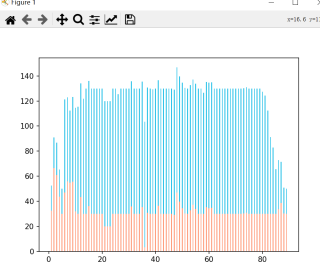
#matpltlib堆叠柱形图问题
import matplotlib.pyplot as plt
plt.figure()

x = range(1, 90)
a =[32.48893, 66.335213, 61.010075, 43.615044, 30.0, 47.048744, 56.006947, 54.796486, 55.633141, 31.869307, 30.0,
      43.338078, 30.0, 30.0, 35.987534, 30.0, 30.0, 30.0, 30.0, 30.0, 20.0, 20.0, 20.0, 30.0, 30.0, 30.0, 30.0, 30.0,
      30.0, 30.0, 35.711754, 30.0, 30.0, 30.0, 35.391739, 3.367466, 30.710413, 30.0, 30.0, 30.0, 36.45649, 30.0, 30.0,
      30.0, 30.0, 30.0, 29.179741, 46.937462, 39.757786, 34.5856743, 30.3254433, 30.0, 32.6565285, 37.276352, 33.792843,
      30.0, 30.0, 30.0, 35.270195, 34.573338, 34.807304, 30.0, 30.0,
      30.0, 30.0, 30.0, 30.0, 30.0, 30.0, 30.0, 30.0, 30.0, 30.2616196, 30.931105, 30.0, 30.0, 30.0, 30.0, 30.0, 30.0,
      30.0, 30.0, 30.0, 30.0, 30.0,  33.7542, 38.645329, 30.256792, 30.0]
b = [20.0, 24.546633, 25.635265, 21.700287, 20.0, 74.242142,
       66.942673, 57.671547, 67.6428549, 82.78205, 85.413986, 90.747169, 91.73587, 100.0, 100.0, 100.0, 100.0, 100.0,
       100.0, 100.0, 100.0, 100.0, 100.0, 100.0, 100.0, 95.523148, 100.0, 100.0, 100.0, 100.0, 100.0, 100.0, 100.0,
       100.0, 100.0, 100.0, 100.0, 100.0, 99.354309, 100.0, 100.0, 100.0, 100.0, 100.0, 100.0, 100.0, 100.0, 100.0,
       100.0, 100.0, 100.0, 100.0, 100.0, 100.0, 100.0, 100.0, 100.0, 96.534683, 100.0, 100.0, 100.0, 100.0, 100.0,
       100.0, 100.0, 100.0, 100.0, 100.0, 100.0, 100.0, 100.0, 100.0, 100.0, 100.0, 100.0, 100.0, 100.0, 100.0, 100.0,
       97.34684, 94.393402, 82335678.0,61.29287, 52.813599, 35.591305, 39.1617813, 32.950611, 20.475721, 20.0]

rgbcolor = [(255 / 255, 159 / 255, 127 / 255), (50 / 255, 196 / 255, 233 / 255), (252 / 255, 114 / 255, 147 / 255)]
plt.bar(x, b, width=0.35, bottom=a, color=rgbcolor[1], label='b')
plt.bar(x, a, width=0.35, color=rgbcolor[0], label='a')
plt.show()
单独画a的柱形图显示,把b的数据堆叠在a之上,运行代码没有错误,但不显示了。请问这是为什么?