代码:
import matplotlib.pyplot as plt
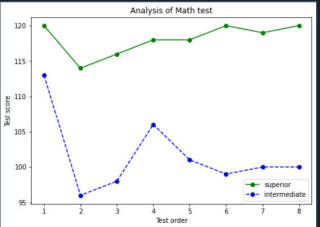
x = [1,2,3,4,5,6,7,8]
y1 = [120,114,116,118,118,120,119,120]
y2 = [113,96,98,106,101,99,100,100]
fig = plt.figure(frameon=True)
ax = fig.add_axes([0,0,1,1])
l1 = ax.plot(x,y1,"go-")
l2 = ax.plot(x,y2,"bo--")
ax.legend(labels=("superior","intermediate"))
ax.set_xlabel("Test order")
ax.set_ylabel("Test score")
ax.set_title("Analysis of Math test")
plt.savefig("got.png")
结果是这样的:
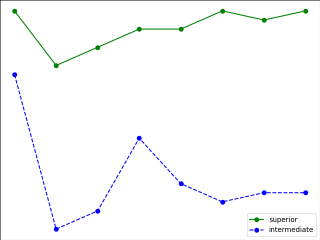
为什么没有显示边框?怎么处理?