

请问最后my_layout部分为何会报错?
import requests
from plotly.graph_objs import Bar
from plotly import offline
url = 'https://api.github.com/search/repositories?q=language:python&sort=stars'
headers = {'Accept': 'application/vnd.github.v3+json'}
r = requests.get(url, headers=headers)
print(f'Status code: {r.status_code}')
# 处理结果
response_dict = r.json()
repo_dicts = response_dict['items']
repo_names, stars = [], []
for repo_dict in repo_dicts:
repo_names.append(repo_dict['name'])
stars.append(repo_dict['stargazers_count'])
# 可视化
data = [{
'type': 'bar',
'x': repo_names,
'y': stars,
'marker': {
'color': 'rgb(60, 100, 150)',
'line': {'width': 1.5, 'color': 'rab(25, 25, 25)'},
},
'opacity': 0.6,
}]
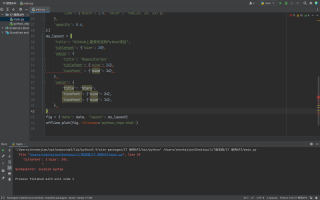
my_layout = {
'title': "Github上最受欢迎的Python项目",
'titlefont': {'size': 28},
'xaxis': {
'title': 'Repositories'
'titlefont': {'size': 24},
'tickfont' : {'size': 14},
},
'yaxis': {
'title': 'Stars',
'tickfont': {'size': 24},
'tickfont': {'size': 14},
},
}
fig = {'data': data, 'layout': my_layout}
offline.plot(fig, filename='python_repo.html')


