
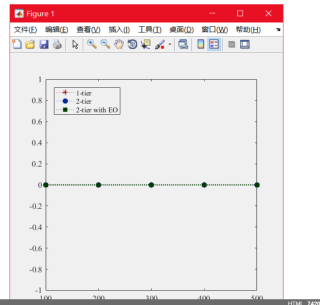
我的matlab运行后是这样为啥呀,路径我也改成日志的了。
配置文件
%-----------------------------https://img-mid.csdnimg.cn/release/static/image/mid/ask/023414002976116.png "#left")
---------------------------------
%description
% returns a value according to the given argumentssss
%--------------------------------------------------------------
function [ret_val] = getConfiguration(argType)
    if(argType == 1)
           ret_val = 'D:\Java\EdgeCloudSim-master\sim_results\ite\app1';
    elseif(argType == 2)
        ret_val = 1; %Number of iterations
    elseif(argType == 3)
        ret_val = 100; %min number of mobile device
    elseif(argType == 4)
        ret_val = 100; %step size of mobile device count
    elseif(argType == 5)
        ret_val =500; %max number of mobile device
    elseif(argType == 6)
        ret_val = 1; %xTickLabelCoefficient
    elseif(argType == 7)
        ret_val = {'SINGLE_TIER','TWO_TIER','TWO_TIER_WITH_EO'};
    elseif(argType == 8)
        ret_val = {'1-tier','2-tier','2-tier with EO'};
    elseif(argType == 9)
        ret_val=[10 3 12 12]; %position of figure
    elseif(argType == 10)
        ret_val = 'Number of Mobile Devices'; %Common text for x axis
    elseif(argType == 11)
        ret_val = 1; %return 1 if you want to save figure as pdf
    elseif(argType == 12)
        ret_val = 0; %return 1 if you want to plot errors
    elseif(argType == 20)
        ret_val=1; %return 1 if graph is plotted colerful
    elseif(argType == 21)
        ret_val=[0.55 0 0]; %color of first line
    elseif(argType == 22)
        ret_val=[0 0.15 0.6]; %color of second line
    elseif(argType == 23)
        ret_val=[0 0.23 0]; %color of third line
    elseif(argType == 24)
        ret_val=[0.6 0 0.6]; %color of fourth line
    elseif(argType == 25)
        ret_val=[0.08 0.08 0.08]; %color of fifth line
    elseif(argType == 26)
        ret_val=[0 0.8 0.8]; %color of sixth line
    elseif(argType == 27)
        ret_val=[0.8 0.4 0]; %color of seventh line
    elseif(argType == 28)
        ret_val=[0.8 0.8 0]; %color of eighth line
    elseif(argType == 40)
        ret_val={'-k*','-ko','-ks','-kv','-kp','-kd','-kx','-kh'}; %line style (marker) of the colerless line
    elseif(argType == 50)
        ret_val={':k*',':ko',':ks',':kv',':kp',':kd',':kx',':kh'}; %line style (marker) of the colerfull line
    end
end
plotGenericResult文件
function [] = plotGenericResult(rowOfset, columnOfset, yLabel, appType, calculatePercentage)
    folderPath = getConfiguration(1);
    numOfSimulations = getConfiguration(2);
    startOfMobileDeviceLoop = getConfiguration(3);
    stepOfMobileDeviceLoop = getConfiguration(4);
    endOfMobileDeviceLoop = getConfiguration(5);
    xTickLabelCoefficient = getConfiguration(6);

    scenarioType = getConfiguration(7);
    legends = getConfiguration(8);
    numOfMobileDevices = (endOfMobileDeviceLoop - startOfMobileDeviceLoop)/stepOfMobileDeviceLoop + 1;

    pos=getConfiguration(9);

    all_results = zeros(numOfSimulations, size(scenarioType,2), numOfMobileDevices);
    min_results = zeros(size(scenarioType,2), numOfMobileDevices);
    max_results = zeros(size(scenarioType,2), numOfMobileDevices);

    for s=1:numOfSimulations
        for i=1:size(scenarioType,2)
            for j=1:numOfMobileDevices
                try
                    mobileDeviceNumber = startOfMobileDeviceLoop + stepOfMobileDeviceLoop * (j-1);
                    filePath = strcat(folderPath,'\ite',int2str(s),'\SIMRESULT_',char(scenarioType(i)),'_NEXT_FIT_',int2str(mobileDeviceNumber),'DEVICES_',appType,'_GENERIC.log');

                    readData = dlmread(filePath,';',rowOfset,0);
                    value = readData(1,columnOfset);
                    if(strcmp(calculatePercentage,'percentage_for_all'))
                        readData = dlmread(filePath,';',1,0);
                        totalTask = readData(1,1)+readData(1,2);
                        value = (100 * value) / totalTask;
                    elseif(strcmp(calculatePercentage,'percentage_for_completed'))
                        readData = dlmread(filePath,';',1,0);
                        totalTask = readData(1,1);
                        value = (100 * value) / totalTask;
                    elseif(strcmp(calculatePercentage,'percentage_for_failed'))
                        readData = dlmread(filePath,';',1,0);
                        totalTask = readData(1,2);
                        value = (100 * value) / totalTask;
                    end

                    all_results(s,i,j) = value;

            end
        end
    end

    if(numOfSimulations == 1)
        results = all_results;
    else
        results = mean(all_results); %still 3d matrix but 1xMxN format
    end

    results = squeeze(results); %remove singleton dimensions

    for i=1:size(scenarioType,2)
        for j=1:numOfMobileDevices
            x=all_results(:,i,j);                    % Create Data
            SEM = std(x)/sqrt(length(x));            % Standard Error
            ts = tinv([0.05  0.95],length(x)-1);   % T-Score
            CI = mean(x) + ts*SEM;                   % Confidence Intervals

            if(CI(1) < 0)
                CI(1) = 0;
            end

            if(CI(2) < 0)
                CI(2) = 0;
            end

            min_results(i,j) = results(i,j) - CI(1);
            max_results(i,j) = CI(2) - results(i,j);
        end
    end

    types = zeros(1,numOfMobileDevices);
    for i=1:numOfMobileDevices
        types(i)=startOfMobileDeviceLoop+((i-1)*stepOfMobileDeviceLoop);
    end

    hFig = figure;
    set(hFig, 'Units','centimeters');
    set(hFig, 'Position',pos);
    set(0,'DefaultAxesFontName','Times New Roman');
    set(0,'DefaultTextFontName','Times New Roman');
    set(0,'DefaultAxesFontSize',10);
    set(0,'DefaultTextFontSize',12);
    if(getConfiguration(20) == 1)
        for i=1:1:numOfMobileDevices
            xIndex=startOfMobileDeviceLoop+((i-1)*stepOfMobileDeviceLoop);

            markers = getConfiguration(50);
            for j=1:size(scenarioType,2)
                plot(xIndex, results(j,i),char(markers(j)),'MarkerFaceColor',getConfiguration(20+j),'color',getConfiguration(20+j));
                hold on;
            end
        end

        for j=1:size(scenarioType,2)
            if(getConfiguration(12) == 1)
                errorbar(types, results(j,:), min_results(j,:),max_results(j,:),':k','color',getConfiguration(20+j),'LineWidth',1.5);
            else
                plot(types, results(j,:),':k','color',getConfiguration(20+j),'LineWidth',1.5);
            end
            hold on;
        end

        set(gca,'color','none');
    else
        markers = getConfiguration(40);
        for j=1:size(scenarioType,2)
            if(getConfiguration(12) == 1)
                errorbar(types, results(j,:),min_results(j,:),max_results(j,:),char(markers(j)),'MarkerFaceColor','w','LineWidth',1.2);
            else
               plot(types, results(j,:),char(markers(j)),'MarkerFaceColor','w','LineWidth',1.2);
            end
            hold on;
        end

    end

    lgnd = legend(legends,'Location','NorthWest');
    if(getConfiguration(20) == 1)
        set(lgnd,'color','none');
    end

    hold off;
    axis square
    xlabel(getConfiguration(10));
    set(gca,'XTick', (startOfMobileDeviceLoop*xTickLabelCoefficient):(stepOfMobileDeviceLoop*xTickLabelCoefficient):endOfMobileDeviceLoop);
    set(gca,'XTickLabel', (startOfMobileDeviceLoop*xTickLabelCoefficient):(stepOfMobileDeviceLoop*xTickLabelCoefficient):endOfMobileDeviceLoop);
    ylabel(yLabel);
    set(gca,'XLim',[startOfMobileDeviceLoop-5 endOfMobileDeviceLoop+5]);

    set(get(gca,'Xlabel'),'FontSize',12)
    set(get(gca,'Ylabel'),'FontSize',12)
    set(lgnd,'FontSize',11)

    if(getConfiguration(11) == 1)
        set(hFig, 'PaperUnits', 'centimeters');
        set(hFig, 'PaperPositionMode', 'manual');
        set(hFig, 'PaperPosition',[0 0 pos(3) pos(4)]);
        set(gcf, 'PaperSize', [pos(3) pos(4)]); %Keep the same paper size
        filename = strcat(folderPath,'\',int2str(rowOfset),'_',int2str(columnOfset),'_',appType);
        saveas(gcf, filename, 'pdf');
    end
end
plotAvgFailedTask文件
function [] = plotAvgFailedTask()

    plotGenericResult(1, 2, 'Failed Tasks (%)', 'ALL_APPS', 'percentage_for_all');
    plotGenericResult(1, 2, {'Failed Tasks for';'Augmented Reality App (%)'}, 'AUGMENTED_REALITY', 'percentage_for_all');
    plotGenericResult(1, 2, 'Failed Tasks for Health App (%)', 'HEALTH_APP', 'percentage_for_all');
    plotGenericResult(1, 2, {'Failed Tasks for';'Infotainment App (%)'}, 'INFOTAINMENT_APP', 'percentage_for_all');
    plotGenericResult(1, 2, 'Failed Tasks for Heavy Comp. App (%)', 'HEAVY_COMP_APP', 'percentage_for_all');

    plotGenericResult(2, 2, 'Failed Tasks on Edge (%)', 'ALL_APPS', 'percentage_for_all');
    plotGenericResult(2, 2, {'Failed Tasks on Edge';'for Augmented Reality App (%)'}, 'AUGMENTED_REALITY', 'percentage_for_all');
    plotGenericResult(2, 2, 'Failed Tasks on Edge for Health App (%)', 'HEALTH_APP', 'percentage_for_all');
    plotGenericResult(2, 2, 'Failed Tasks on Edge for Infotainment App (%)', 'INFOTAINMENT_APP', 'percentage_for_all');
    plotGenericResult(2, 2, 'Failed Tasks on Edge for Heavy Comp. App (%)', 'HEAVY_COMP_APP', 'percentage_for_all');

    plotGenericResult(3, 2, 'Failed Tasks on Cloud (%)', 'ALL_APPS', 'percentage_for_all');
    plotGenericResult(3, 2, {'Failed Tasks on Cloud for';'Augmented Reality App (%)'}, 'AUGMENTED_REALITY', 'percentage_for_all');
    plotGenericResult(3, 2, 'Failed Tasks on Cloud for Health App (%)', 'HEALTH_APP', 'percentage_for_all');
    plotGenericResult(3, 2, 'Failed Tasks on Cloud for Infotainment App (%)', 'INFOTAINMENT_APP', 'percentage_for_all');
    plotGenericResult(3, 2, 'Failed Tasks on Cloud for Heavy Comp. App (%)', 'HEAVY_COMP_APP', 'percentage_for_all');

end


