
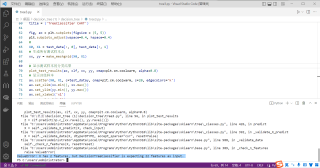
大家好,我的代码报错,靠自己不能解决,望善良友友帮忙一下~
```python
from pyexpat import features
import pandas as pd
import pandas as pd
import numpy as np

from sklearn.model_selection import train_test_split
from sklearn.model_selection import cross_val_score
from sklearn import tree
from sklearn.metrics import confusion_matrix
import matplotlib.pyplot as plt
import pandas as pd
from sklearn.preprocessing import OneHotEncoder
mushroom = 'D:/桌面/decision_tree (1)/decision_tree/mushrooms.csv'
mushroom = pd.read_csv(mushroom, sep=',', decimal='.')
mushroom=pd.DataFrame(mushroom)
# print(type(mushroom))
# print(mushroom)
X = mushroom.iloc[:,1:]
y = mushroom["class"]
#将数据进行数值化
i = 0
while(i<22):
    y_flag = X.iloc[:,i].unique()
    X.iloc[:,i] = X.iloc[:,i].apply(lambda x : y_flag.tolist().index(x))
    i = i+1
# print(X.head())
y = y.map(dict(zip(['e','p'],[0,1])))


test_data = np.array(X)
test_datay=np.array(y)
print(y)
print(test_datay)

x_train, x_test, y_train, y_test = train_test_split(X,y,test_size=0.3,random_state=4)
# 创建决策树对象,使用信息熵作为依据
# print(x_test)
# print(y_test)
clf = tree.DecisionTreeClassifier(max_depth=4)
#criterion='entropy',max_depth=5
clf.fit(x_train,y_train)
#查看评分即准确率
score=clf.score(x_test,y_test)
print("决策树的准确率为:",score)

# 生成所有测试样本点
def make_meshgrid(x, y, h=.02):
    x_min, x_max = x.min() - 1, x.max() + 1
    y_min, y_max = y.min() - 1, y.max() + 1
    xx, yy = np.meshgrid(np.arange(x_min, x_max, h),
                np.arange(y_min, y_max, h))
    return xx, yy

# 对测试样本进行预测,并显示
def plot_test_results(ax, clf, xx, yy, **params):
    Z = clf.predict(np.c_[xx.ravel(), yy.ravel()])
    Z = Z.reshape(xx.shape)
    ax.contourf(xx, yy, Z, **params)

title = ('TreeClassifier CART')

fig, ax = plt.subplots(figsize = (5, 5))
plt.subplots_adjust(wspace=0.4, hspace=0.4)
#
X0, X1 = test_data[:, 0], test_data[:, 1]
# 生成所有测试样本点
xx, yy = make_meshgrid(X0, X1)

# 显示测试样本的分类结果
plot_test_results(ax, clf, xx, yy, cmap=plt.cm.coolwarm, alpha=0.8)
# 显示训练样本
ax.scatter(X0, X1, c=test_datay, cmap=plt.cm.coolwarm, s=20, edgecolors='k')
ax.set_xlim(xx.min(), xx.max())
ax.set_ylim(yy.min(), yy.max())
ax.set_xlabel('x1')
ax.set_ylabel('x2')
ax.set_xticks(())
ax.set_yticks(())
ax.set_title(title)
plt.show()
```


