
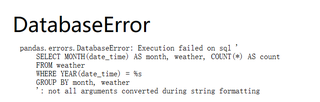
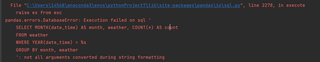
为什么一直数据库错误弄了一下午还是没有弄好试了好多办法都没有成功
import requests
from lxml import etree
import csv
import pandas as pd
import pymysql
from fake_useragent import UserAgent
import time
from pyecharts.charts import Timeline,Bar
from pyecharts import options as opts

def getWeather(url):
    print("getWeather:"+url)
    weather_info=[]
    headers={
        'User-Agent': UserAgent().random,
        'content-type':'charst=uft8'
    }
    res=requests.get(url,headers=headers)
    res_html=etree.HTML(res.text)
    res_list=res_html.xpath("//ul[@class='thrui']/li")

    for li in res_list:
        day_weather_info={}
        day_weather_info['data_time']=li.xpath('./div[1]/text()')[0].split(' ')[0]
        high=li.xpath('./div[2]/text()')[0]
        day_weather_info['high']=high[:high.find('℃')]
        low=li.xpath('./div[3]/text()')[0]
        day_weather_info['low']=low[:low.find('℃')]
        day_weather_info['weather']=li.xpath('./div[4]/text()')[0]
        weather_info.append(day_weather_info)

    return weather_info

def getUrl(year, city):

    print(city)
    print(year)

    weathers = []
    for month in range(1, 13):
        if month < 10:
            weather_time = year + ('0' + str(month))
        else:
            weather_time = year + str(month)

        city_url = f'https://lishi.tianqi.com/{city}/{weather_time}.html'
        weather = getWeather(city_url)
        time.sleep(1)
        weathers.append(weather)

    csv_name = f'{city}_{year}_weather.csv'
    with open(csv_name, 'w', newline='', encoding='utf-8') as csvfile:
        writer = csv.writer(csvfile)
        writer.writerow(['日期', '最高气温', '最低气温', '天气'])
        list_year = []
        for month_weather in weathers:
            for day_weather_dict in month_weather:
                list_year.append(list(day_weather_dict.values()))
        writer.writerows(list_year)

    return csv_name


def saveToMySQL(csv_file):
    conn = pymysql.connect(
        host='localhost',
        port=3306,
        user='root',
        password='123456',
        db='weather_db',
        charset='utf8mb4'
    )
    cursor = conn.cursor()

    # 创建表格
    create_table_sql = """
    CREATE TABLE IF NOT EXISTS weather (
        id INT AUTO_INCREMENT PRIMARY KEY,
        date_time DATE,
        high_temperature INT,
        low_temperature INT,
        weather VARCHAR(255)
    )
    """
    cursor.execute(create_table_sql)

    with open(csv_file, 'r', encoding='utf-8') as file:
        reader = csv.reader(file)
        next(reader)
        for row in reader:
            date_time = row[0]
            high_temperature = int(row[1])
            low_temperature = int(row[2])
            weather = row[3]
            insert_sql = "INSERT INTO weather (date_time, high_temperature, low_temperature, weather) VALUES (%s, %s, %s, %s)"
            cursor.execute(insert_sql, (date_time, high_temperature, low_temperature, weather))

    conn.commit()
    cursor.close()
    conn.close()

def create_html(year, city):
    csv_file = getUrl(year, city)
    saveToMySQL(csv_file)

    # 从数据库读取数据
    conn = pymysql.connect(
        host='localhost',
        port=3306,
        user='root',
        password='123456',
        db='weather_db',
        charset='utf8mb4'
    )
    sql = """
    SELECT MONTH(date_time) AS month, weather, COUNT(*) AS count
    FROM weather
    WHERE YEAR(date_time) = %s
    GROUP BY month, weather
    """
    df_agg = pd.read_sql(sql, conn, params=(year,city))

    timeline = Timeline()
    timeline.add_schema(play_interval=1000)

    for month in df_agg['month'].unique():
        data = (df_agg[df_agg['month'] == month][['weather', 'count']]
                .sort_values(by='count', ascending=True)
                .values.tolist()
                )

        bar = Bar()
        bar.add_xaxis([x[0] for x in data])
        bar.add_yaxis('', [x[1] for x in data])
        bar.reversal_axis()
        bar.set_series_opts(label_opts=opts.LabelOpts(position='right'))
        bar.set_global_opts(title_opts=opts.TitleOpts(title=f'{city} {year}年每月天气变化'))
        timeline.add(bar, f'{month}月')

    timeline.render('C:\\Users\\14568\\PycharmProjects\\pythonProject7\\Main Flask in\\weather.html')


